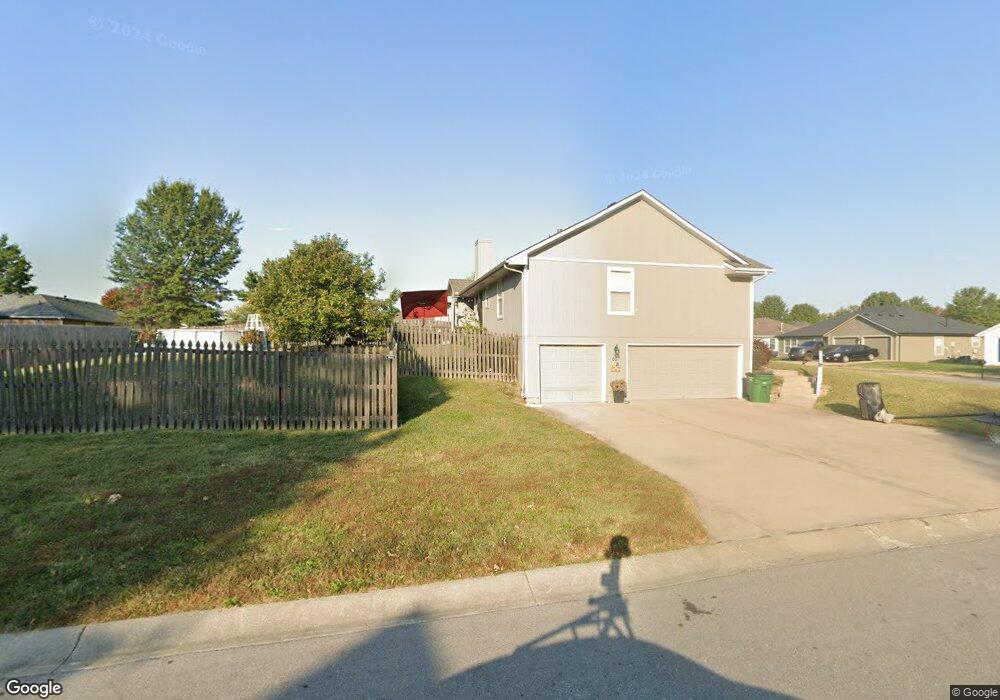
607 SW Gateway Grain Valley, MO 64029
Estimated Value: $276,000 - $335,000
3
Beds
2
Baths
1,326
Sq Ft
$224/Sq Ft
Est. Value
About This Home
This home is located at 607 SW Gateway, Grain Valley, MO 64029 and is currently estimated at $296,386, approximately $223 per square foot. 607 SW Gateway is a home located in Jackson County with nearby schools including Grain Valley High School.
Ownership History
Date
Name
Owned For
Owner Type
Purchase Details
Closed on
Aug 4, 2017
Sold by
Mueller Wade and Mueller Baylie M
Bought by
Burton Tracy and Burton Erica
Current Estimated Value
Purchase Details
Closed on
Apr 27, 2010
Sold by
Munzuris Rocky and Munzuris Laurie
Bought by
Eaton Baylie M
Home Financials for this Owner
Home Financials are based on the most recent Mortgage that was taken out on this home.
Original Mortgage
$135,000
Interest Rate
4.91%
Mortgage Type
New Conventional
Purchase Details
Closed on
Feb 14, 2003
Sold by
Sommers Harve
Bought by
Munzuris Rocky and Munzuris Laurie
Home Financials for this Owner
Home Financials are based on the most recent Mortgage that was taken out on this home.
Original Mortgage
$104,500
Interest Rate
5.9%
Mortgage Type
Purchase Money Mortgage
Purchase Details
Closed on
Jul 10, 2002
Sold by
Countryside Development Llc
Bought by
Sommers Harve
Create a Home Valuation Report for This Property
The Home Valuation Report is an in-depth analysis detailing your home's value as well as a comparison with similar homes in the area
Home Values in the Area
Average Home Value in this Area
Purchase History
| Date | Buyer | Sale Price | Title Company |
|---|---|---|---|
| Burton Tracy | -- | None Available | |
| Eaton Baylie M | -- | Kansas City Title | |
| Munzuris Rocky | -- | Ati Title Company | |
| Sommers Harve | -- | Ati Title Company |
Source: Public Records
Mortgage History
| Date | Status | Borrower | Loan Amount |
|---|---|---|---|
| Previous Owner | Eaton Baylie M | $135,000 | |
| Previous Owner | Munzuris Rocky | $104,500 |
Source: Public Records
Tax History Compared to Growth
Tax History
| Year | Tax Paid | Tax Assessment Tax Assessment Total Assessment is a certain percentage of the fair market value that is determined by local assessors to be the total taxable value of land and additions on the property. | Land | Improvement |
|---|---|---|---|---|
| 2025 | $2,689 | $37,544 | $7,826 | $29,718 |
| 2024 | $2,589 | $32,648 | $4,167 | $28,481 |
| 2023 | $2,589 | $32,648 | $5,478 | $27,170 |
| 2022 | $2,825 | $31,160 | $3,605 | $27,555 |
| 2021 | $2,759 | $31,160 | $3,605 | $27,555 |
| 2020 | $2,796 | $31,155 | $3,605 | $27,550 |
| 2019 | $2,739 | $31,155 | $3,605 | $27,550 |
| 2018 | $1,513,627 | $27,114 | $3,137 | $23,977 |
| 2017 | $2,551 | $27,114 | $3,137 | $23,977 |
| 2016 | $2,459 | $26,144 | $3,864 | $22,280 |
| 2014 | $2,429 | $25,631 | $3,788 | $21,843 |
Source: Public Records
Map
Nearby Homes
- 501 SW Creek Ridge Dr
- 836 SW Lee Ann Dr
- 309 SW Creek Ridge Dr
- 808 SW Country Hill Dr
- 601 SW Nelson Dr
- 709 SW Harvest Cir
- 1001 SW Cross Creek Dr
- 621 SW Tisha Ln
- 1010 SW Cross Creek Dr
- 1400 SW Cross Creek Dr
- 506 SW Meadowood Dr
- 800 SW Hilltop Ct
- 115 E Old Us 40 Hwy N A
- 913 SW Abar Dr
- 725 SW Tisha Ln
- 636 SW Lakeview Dr
- 33100 E Oak Hill School Rd
- 32306 E Stony Point School Rd
- 1200 SW Foxtail Dr
- 1203 SW Lakeview Dr
- 607 SW Muriel Dr
- 609 SW Muriel Dr
- 606 SW Creek Ridge Dr
- 606 SW Muriel Dr
- 851 SW Ridgeview Dr
- 611 SW Muriel Dr
- 608 SW Creek Ridge Dr
- 608 SW Muriel Dr
- 855 SW Ridgeview Dr
- 610 SW Creek Ridge Dr
- 849 SW Ridgeview Dr
- 610 SW Muriel Dr
- 857 SW Ridgeview Dr
- 613 SW Muriel Dr
- 847 SW Ridgeview Dr
- 612 SW Creek Ridge Dr
- 844 SW Ridgeview Dr
- 852 SW Country Hill Dr
- 612 SW Muriel Dr
- 850 SW Country Hill Dr