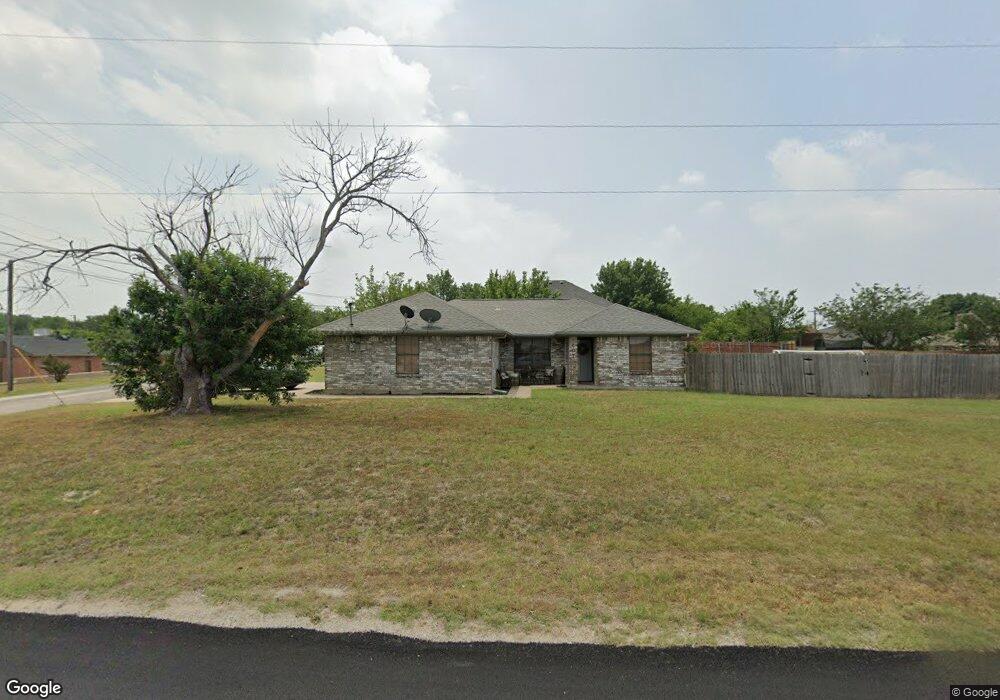
607 W Mulberry St Decatur, TX 76234
Estimated Value: $245,900 - $287,000
3
Beds
2
Baths
1,275
Sq Ft
$215/Sq Ft
Est. Value
About This Home
This home is located at 607 W Mulberry St, Decatur, TX 76234 and is currently estimated at $273,975, approximately $214 per square foot. 607 W Mulberry St is a home located in Wise County with nearby schools including Decatur High School and Victory Christian Academy.
Ownership History
Date
Name
Owned For
Owner Type
Purchase Details
Closed on
Apr 3, 2015
Sold by
Flake Linda
Bought by
Bautista Jaime
Current Estimated Value
Home Financials for this Owner
Home Financials are based on the most recent Mortgage that was taken out on this home.
Original Mortgage
$101,600
Outstanding Balance
$78,440
Interest Rate
3.82%
Mortgage Type
Purchase Money Mortgage
Estimated Equity
$195,535
Purchase Details
Closed on
Apr 2, 2007
Sold by
Remington Matthew D and Remington Samantha A
Bought by
Flake Linda
Home Financials for this Owner
Home Financials are based on the most recent Mortgage that was taken out on this home.
Original Mortgage
$16,050
Interest Rate
6.13%
Mortgage Type
New Conventional
Purchase Details
Closed on
Mar 2, 2004
Sold by
Hogan James
Bought by
Bautista Jaime
Purchase Details
Closed on
Mar 26, 2002
Sold by
Hudson Karen
Bought by
Bautista Jaime
Purchase Details
Closed on
Aug 30, 2001
Sold by
Hudson Karen and Hudson Burrell
Bought by
Bautista Jaime
Create a Home Valuation Report for This Property
The Home Valuation Report is an in-depth analysis detailing your home's value as well as a comparison with similar homes in the area
Home Values in the Area
Average Home Value in this Area
Purchase History
| Date | Buyer | Sale Price | Title Company |
|---|---|---|---|
| Bautista Jaime | -- | None Available | |
| Flake Linda | -- | -- | |
| Bautista Jaime | -- | -- | |
| Bautista Jaime | -- | -- | |
| Bautista Jaime | -- | -- |
Source: Public Records
Mortgage History
| Date | Status | Borrower | Loan Amount |
|---|---|---|---|
| Open | Bautista Jaime | $101,600 | |
| Previous Owner | Flake Linda | $16,050 |
Source: Public Records
Tax History Compared to Growth
Tax History
| Year | Tax Paid | Tax Assessment Tax Assessment Total Assessment is a certain percentage of the fair market value that is determined by local assessors to be the total taxable value of land and additions on the property. | Land | Improvement |
|---|---|---|---|---|
| 2025 | $3,384 | $259,362 | $73,745 | $185,617 |
| 2024 | $3,384 | $242,969 | $0 | $0 |
| 2023 | $4,007 | $220,881 | $0 | $0 |
| 2022 | $4,397 | $200,801 | $0 | $0 |
| 2021 | $4,166 | $192,290 | $43,980 | $148,310 |
| 2020 | $3,892 | $166,700 | $40,920 | $125,780 |
| 2019 | $3,739 | $163,620 | $40,920 | $122,700 |
| 2018 | $3,546 | $137,150 | $21,440 | $115,710 |
| 2017 | $3,297 | $127,010 | $18,380 | $108,630 |
| 2016 | $2,917 | $119,330 | $18,380 | $100,950 |
| 2015 | -- | $98,050 | $18,380 | $79,670 |
| 2014 | -- | $97,340 | $18,380 | $78,960 |
Source: Public Records
Map
Nearby Homes
- 606 W Mulberry St
- 304 Cyndilu Ln
- 407 N Lane St
- 4112 U S 380
- 50+/- acres U S 380
- 0 N Hwy 287 Unit 25379920
- 700 N Church St
- 802 N Church St
- 903 N Miller St
- 114 Sondra Lin Blvd
- 1 S Martin Extension
- W W Rose Ave
- 307 E Vernon St
- 601 W Brady St
- 602 N Cates St
- 401 S Holman St
- TBD Farm To Market 51
- 1404 Shady Ln
- 305 E Shoemaker St
- 1408 N Business 287
- 703 N Cowan St
- 704 Crestridge Ct
- 702 Crestridge Ct
- 701 N Cowan St
- 700 Crestridge Ct
- 607 N Cowan St
- 608 Crestridge Ct
- 604 W Mulberry St
- 701 W Mulberry St
- 702 Parkridge Dr
- 401 W Mulberry St
- 605 N Cowan St
- 606 Crestridge Ct
- 701 Parkridge Dr
- 703 W Mulberry St
- 804 N Washburn St
- 704 Parkridge Dr
- 603 N Cowan St
- 604 Crestridge Ct
- 705 W Mulberry St