Estimated Value: $139,000 - $165,620
3
Beds
1
Bath
1,236
Sq Ft
$124/Sq Ft
Est. Value
About This Home
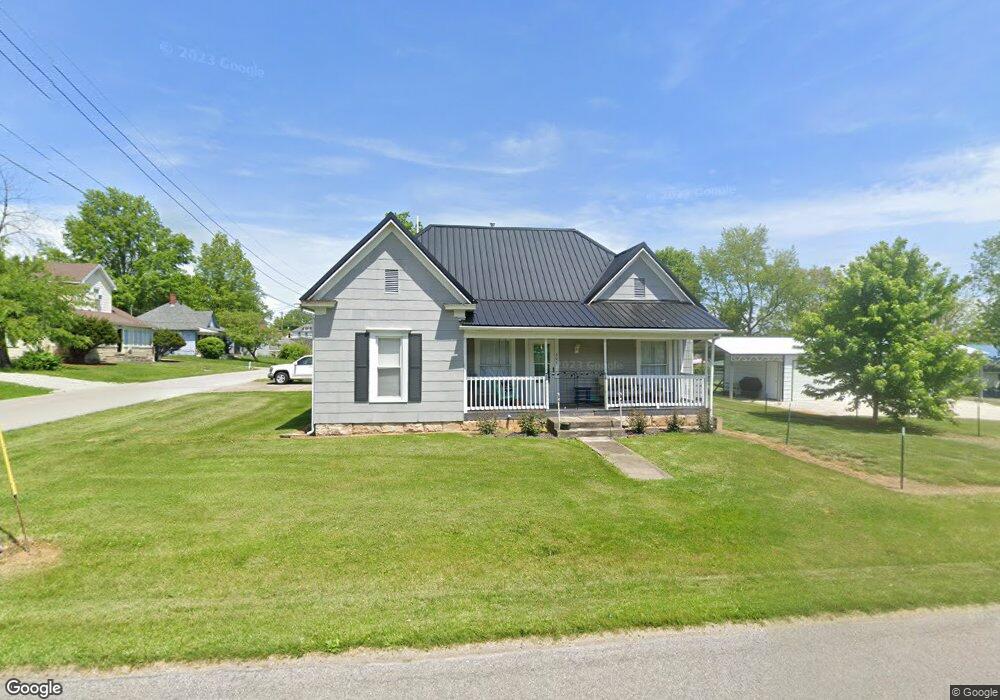
This home is located at 607 W Walnut St, Salem, IN 47167 and is currently estimated at $153,655, approximately $124 per square foot. 607 W Walnut St is a home located in Washington County with nearby schools including Bradie M. Shrum Lower Elementary School, Salem Middle School, and Salem High School.
Ownership History
Date
Name
Owned For
Owner Type
Purchase Details
Closed on
Dec 18, 2018
Sold by
Janis Ingram
Bought by
Vergason Darwin L
Current Estimated Value
Home Financials for this Owner
Home Financials are based on the most recent Mortgage that was taken out on this home.
Original Mortgage
$88,500
Outstanding Balance
$78,126
Interest Rate
4.9%
Mortgage Type
VA
Estimated Equity
$75,529
Purchase Details
Closed on
Sep 28, 2018
Sold by
Miller Scott D
Bought by
Janis Ingram
Purchase Details
Closed on
Aug 28, 2018
Sold by
Miller Scott D
Bought by
Ingram Janis
Purchase Details
Closed on
Sep 15, 2014
Sold by
Brewer Trevor O
Bought by
Miller Scott D
Purchase Details
Closed on
Jun 24, 2010
Sold by
Miller Duane E and Miller Bonnie J
Bought by
Miller Scott D and Brewer Trevor O
Home Financials for this Owner
Home Financials are based on the most recent Mortgage that was taken out on this home.
Original Mortgage
$41,532
Interest Rate
4.6%
Mortgage Type
Adjustable Rate Mortgage/ARM
Create a Home Valuation Report for This Property
The Home Valuation Report is an in-depth analysis detailing your home's value as well as a comparison with similar homes in the area
Home Values in the Area
Average Home Value in this Area
Purchase History
| Date | Buyer | Sale Price | Title Company |
|---|---|---|---|
| Vergason Darwin L | $88,500 | -- | |
| Vergason Darwin L | $88,500 | Principal Title Services, Llc | |
| Janis Ingram | $32,200 | -- | |
| Ingram Janis | -- | None Available | |
| Miller Scott D | -- | None Available | |
| Miller Scott D | -- | None Available |
Source: Public Records
Mortgage History
| Date | Status | Borrower | Loan Amount |
|---|---|---|---|
| Open | Vergason Darwin L | $88,500 | |
| Previous Owner | Miller Scott D | $41,532 |
Source: Public Records
Tax History Compared to Growth
Tax History
| Year | Tax Paid | Tax Assessment Tax Assessment Total Assessment is a certain percentage of the fair market value that is determined by local assessors to be the total taxable value of land and additions on the property. | Land | Improvement |
|---|---|---|---|---|
| 2024 | $172 | $113,400 | $12,700 | $100,700 |
| 2023 | $97 | $104,100 | $12,700 | $91,400 |
| 2022 | $0 | $95,600 | $12,700 | $82,900 |
| 2021 | $245 | $76,600 | $12,700 | $63,900 |
| 2020 | $245 | $78,100 | $12,700 | $65,400 |
| 2019 | $245 | $59,400 | $12,700 | $46,700 |
| 2018 | $239 | $34,900 | $12,700 | $22,200 |
| 2017 | $730 | $36,500 | $12,700 | $23,800 |
| 2016 | $690 | $34,500 | $12,700 | $21,800 |
| 2014 | $219 | $34,100 | $12,300 | $21,800 |
| 2013 | $202 | $33,700 | $12,700 | $21,000 |
Source: Public Records
Map
Nearby Homes
- 406 W Mulberry St
- 0 W Mulberry St
- 205 S Harrison St
- 101, 103, & 105 Hounds Way
- 303 W Market St
- 213 Washington Blvd
- 104 Hounds Way
- 1106 W Walnut St
- 1000 W Market St
- 207 Southern Ave
- 52 Public Square
- (Tract 2) 5484 State Road 135
- 301 E Market St
- 100 Walnut Tree Dr
- 404 E Mulberry St
- 801 N College Ave
- 800 Hayes Ave
- 115 Nichols Ave
- 701 S Main St
- 808 Locust St
- 203 Franklin St
- 606 W Walnut St
- 205 Franklin St
- 200 N Shelby St
- 202 N Shelby St
- 701 W Walnut St
- 115 Franklin St
- 204 N Shelby St
- 204 Franklin St
- 106 N Shelby St
- 207 Franklin St
- 700 W Walnut St
- 206 N Shelby St
- 206 Franklin St
- 104 N Shelby St
- 113 Franklin St
- 116 Franklin St
- 208 Franklin St
- 602 W Mulberry St
- 111 Franklin St