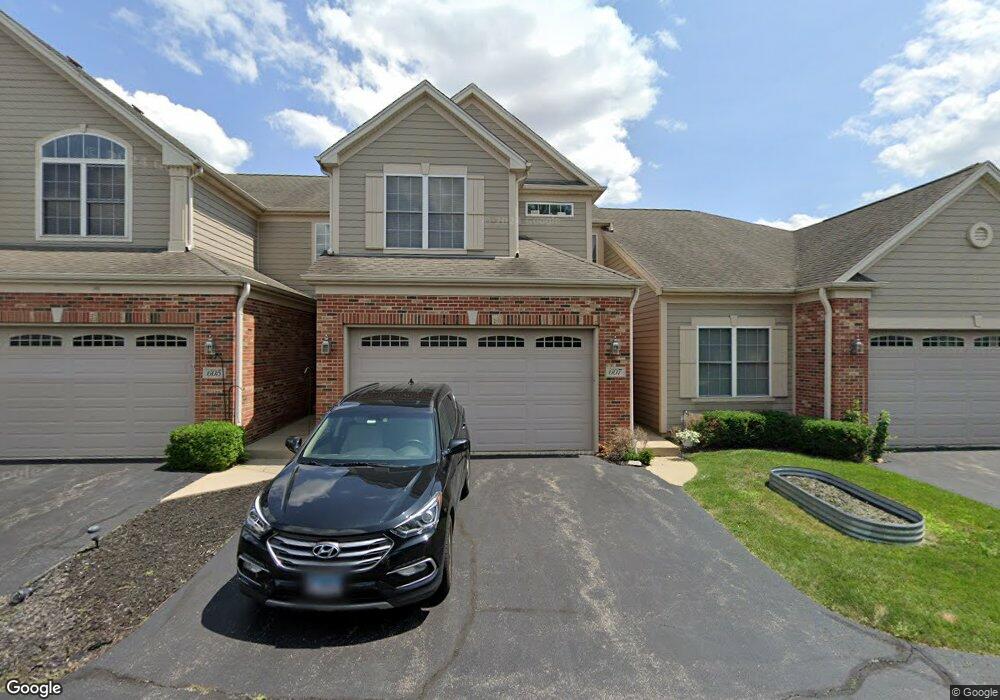
607 W Wegner Rd Unit 607 McHenry, IL 60051
Estimated Value: $283,368 - $332,000
3
Beds
3
Baths
1,732
Sq Ft
$178/Sq Ft
Est. Value
About This Home
This home is located at 607 W Wegner Rd Unit 607, McHenry, IL 60051 and is currently estimated at $308,342, approximately $178 per square foot. 607 W Wegner Rd Unit 607 is a home located in McHenry County with nearby schools including Hilltop Elementary School, Chauncey H Duker School, and Mchenry Middle School.
Ownership History
Date
Name
Owned For
Owner Type
Purchase Details
Closed on
Apr 19, 2019
Sold by
Goudreau Steven A and Goudreau Kelly A
Bought by
Sibrava Brooke and Mchugh Connor
Current Estimated Value
Home Financials for this Owner
Home Financials are based on the most recent Mortgage that was taken out on this home.
Original Mortgage
$175,750
Outstanding Balance
$154,734
Interest Rate
4.37%
Mortgage Type
New Conventional
Estimated Equity
$153,608
Purchase Details
Closed on
Aug 21, 2018
Sold by
Goudreau Steven A and Goudreau Kelly A
Bought by
Goudreau Steven A and Goudreau Kelly A
Purchase Details
Closed on
Jul 6, 2007
Sold by
Lesperance Michael A
Bought by
Goudreau Steven A and Goudreau Ashley N
Home Financials for this Owner
Home Financials are based on the most recent Mortgage that was taken out on this home.
Original Mortgage
$180,000
Interest Rate
6.42%
Mortgage Type
Purchase Money Mortgage
Create a Home Valuation Report for This Property
The Home Valuation Report is an in-depth analysis detailing your home's value as well as a comparison with similar homes in the area
Home Values in the Area
Average Home Value in this Area
Purchase History
| Date | Buyer | Sale Price | Title Company |
|---|---|---|---|
| Sibrava Brooke | $186,500 | Proper Title Llc | |
| Goudreau Steven A | -- | Attorney | |
| Goudreau Steven A | $225,000 | Ticor Title Insurance Co |
Source: Public Records
Mortgage History
| Date | Status | Borrower | Loan Amount |
|---|---|---|---|
| Open | Sibrava Brooke | $175,750 | |
| Previous Owner | Goudreau Steven A | $180,000 |
Source: Public Records
Tax History
| Year | Tax Paid | Tax Assessment Tax Assessment Total Assessment is a certain percentage of the fair market value that is determined by local assessors to be the total taxable value of land and additions on the property. | Land | Improvement |
|---|---|---|---|---|
| 2024 | $5,773 | $77,527 | $9,117 | $68,410 |
| 2023 | $5,563 | $69,525 | $8,176 | $61,349 |
| 2022 | $5,373 | $63,580 | $7,477 | $56,103 |
| 2021 | $5,130 | $59,610 | $7,010 | $52,600 |
| 2020 | $5,067 | $57,823 | $6,800 | $51,023 |
| 2019 | $4,939 | $54,975 | $6,465 | $48,510 |
| 2018 | $5,100 | $51,639 | $6,073 | $45,566 |
| 2017 | $4,999 | $49,472 | $5,818 | $43,654 |
| 2016 | $4,905 | $47,202 | $5,551 | $41,651 |
| 2013 | -- | $44,922 | $5,283 | $39,639 |
Source: Public Records
Map
Nearby Homes
- 610 W Wegner Rd
- 95 W South Dr
- 411 S Lily Lake Rd
- n/a S Lily Lake Rd
- Lot 8 & 9 S Lily Lake Rd
- 803 East Blvd
- 0 Rand Rd
- 132 Rand Rd
- 31754 N Pineview Blvd
- 410 W Riverside Dr
- 31696 N Borre Dr
- 336 Rosedale Dr
- 28609 Augusta Ln
- 31998 W Savannah Dr
- 32012 Savannah Dr
- 32075 Savannah Dr
- 32069 Savannah Dr
- 32018 Savannah Dr
- 212 Bakers Dr W Unit 8005
- 222 Bakers Dr W Unit 8008
- 607 W Wegner Rd
- 607 W Wegner Rd Unit D
- 609 W Wegner Rd Unit 609
- 605 W Wegner Rd Unit 605
- 605 W Wegner Rd
- 605 W Wegner Rd
- 603 W Wegner Rd
- 601 W Wegner Rd
- 601 W Wegner Rd Unit 601
- 615 W Wegner Rd
- 615 W Wegner Rd Unit 3
- 617 W Wegner Rd Unit A
- 617 W Wegner Rd Unit 1
- 613 W Wegner Rd
- 613 W Wegner Rd Unit 2
- 611 W Wegner Rd Unit B
- 611 W Wegner Rd Unit 1
- 611 W Wegner Rd Unit 611
- 608 W Wegner Rd
- 614 W Wegner Rd
Your Personal Tour Guide
Ask me questions while you tour the home.