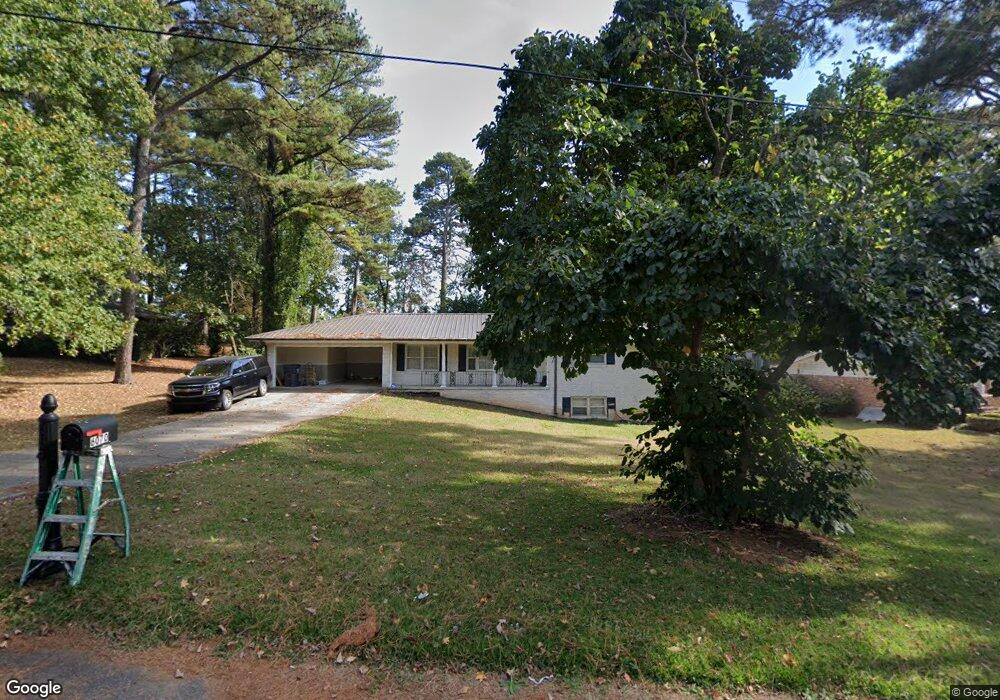
6070 Zachary Ct Norcross, GA 30093
Estimated Value: $323,000 - $375,000
4
Beds
3
Baths
1,545
Sq Ft
$225/Sq Ft
Est. Value
About This Home
This home is located at 6070 Zachary Ct, Norcross, GA 30093 and is currently estimated at $347,525, approximately $224 per square foot. 6070 Zachary Ct is a home located in Gwinnett County with nearby schools including Rockbridge Elementary School, Lilburn Middle School, and Meadowcreek High School.
Ownership History
Date
Name
Owned For
Owner Type
Purchase Details
Closed on
Oct 16, 2024
Sold by
Tran My Duyen Thihoang
Bought by
Garcia Yesica Tran and Tran Thihoang Myduyen
Current Estimated Value
Purchase Details
Closed on
Jun 24, 2011
Sold by
Tran My D T
Bought by
Tran My D T and Tran Nhan H
Home Financials for this Owner
Home Financials are based on the most recent Mortgage that was taken out on this home.
Original Mortgage
$68,395
Interest Rate
4.37%
Mortgage Type
FHA
Purchase Details
Closed on
Nov 2, 2010
Sold by
Herrera Deizi A
Bought by
Jp Morgan Chase Bank Na
Purchase Details
Closed on
Feb 5, 2003
Sold by
Herrera Deizi A
Bought by
Herrera Deizi A
Home Financials for this Owner
Home Financials are based on the most recent Mortgage that was taken out on this home.
Original Mortgage
$159,050
Interest Rate
5.93%
Mortgage Type
New Conventional
Create a Home Valuation Report for This Property
The Home Valuation Report is an in-depth analysis detailing your home's value as well as a comparison with similar homes in the area
Home Values in the Area
Average Home Value in this Area
Purchase History
| Date | Buyer | Sale Price | Title Company |
|---|---|---|---|
| Garcia Yesica Tran | -- | -- | |
| Tran My D T | $65,000 | -- | |
| Tran My D T | -- | -- | |
| Jp Morgan Chase Bank Na | $155,814 | -- | |
| Herrera Deizi A | -- | -- | |
| Herrera Deizi A | $164,000 | -- |
Source: Public Records
Mortgage History
| Date | Status | Borrower | Loan Amount |
|---|---|---|---|
| Previous Owner | Tran My D T | $68,395 | |
| Previous Owner | Herrera Deizi A | $159,050 |
Source: Public Records
Tax History Compared to Growth
Tax History
| Year | Tax Paid | Tax Assessment Tax Assessment Total Assessment is a certain percentage of the fair market value that is determined by local assessors to be the total taxable value of land and additions on the property. | Land | Improvement |
|---|---|---|---|---|
| 2025 | $3,285 | $132,680 | $21,120 | $111,560 |
| 2024 | $3,785 | $150,880 | $21,120 | $129,760 |
| 2023 | $3,785 | $122,760 | $24,800 | $97,960 |
| 2022 | $2,756 | $103,840 | $22,400 | $81,440 |
| 2021 | $2,252 | $77,960 | $16,000 | $61,960 |
| 2020 | $2,269 | $77,960 | $16,000 | $61,960 |
| 2019 | $1,945 | $64,640 | $13,600 | $51,040 |
| 2018 | $1,943 | $64,640 | $13,600 | $51,040 |
| 2016 | $1,555 | $45,680 | $10,400 | $35,280 |
| 2015 | $1,387 | $37,640 | $8,000 | $29,640 |
| 2014 | -- | $37,640 | $8,000 | $29,640 |
Source: Public Records
Map
Nearby Homes
- 1281 Rockfield Cir
- 1415 Commercial Ct
- 1002 Rockbridge Rd
- 1368 Breezy Cir
- 5952 Robin Hood Ln
- 6575 Story Cir
- 903 Redwood Dr
- 5969 Wintergreen Rd
- 1034 Redwood Dr
- 6043 Wintergreen Rd Unit 4J2
- 5970 Wintergreen Rd
- 5950 Wintergreen Rd
- 6090 Wintergreen Rd Unit 1A3
- 6090 Wintergreen Rd
- 6009 Mark Trail Unit 2
- 5775 Dekalb Ln
- 6118 Queen Anne Ct
- 1561 Danbury Dr
- 6379 Wedgeview Ct
- 6393 Wedgeview Ct
- 6060 Zachary Ct
- 6079 Zachary Ct
- 6050 Zachary Ct Unit 1
- 6069 Zachary Ct
- 6055 Rockbridge School Rd
- 1319 Zachary Way
- 1338 Zachary Way
- 6059 Zachary Ct
- 6075 Rockbridge School Rd
- 1309 Zachary Way Unit 3
- 6109 Zachary Dr
- 6110 Zachary Dr Unit 3
- 6095 Rockbridge School Rd
- 1331 Tracy Valley Ct Unit 2
- 6068 Tracy Valley Dr Unit 2
- 6068 Tracy Valley Dr Unit D
- 1348 Zachary Way
- 6058 Tracy Valley Dr Unit 2
- 1321 Tracy Valley Ct
- 6119 Zachary Dr