Estimated Value: $380,000 - $450,000
4
Beds
3
Baths
1,850
Sq Ft
$222/Sq Ft
Est. Value
About This Home
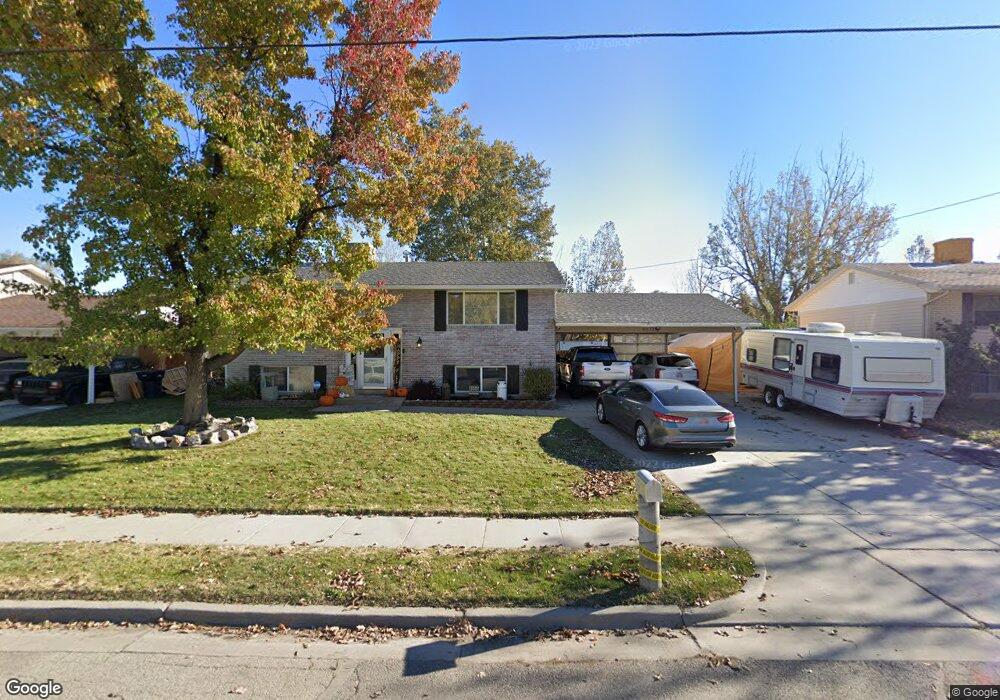
This home is located at 6072 S 2700 W, Roy, UT 84067 and is currently estimated at $411,196, approximately $222 per square foot. 6072 S 2700 W is a home located in Weber County with nearby schools including Municipal School, Roy Junior High School, and Roy High School.
Ownership History
Date
Name
Owned For
Owner Type
Purchase Details
Closed on
May 3, 2016
Bought by
Lacefield Christopher
Current Estimated Value
Home Financials for this Owner
Home Financials are based on the most recent Mortgage that was taken out on this home.
Original Mortgage
$180,667
Outstanding Balance
$143,823
Interest Rate
3.66%
Estimated Equity
$267,373
Purchase Details
Closed on
Dec 11, 2014
Sold by
Jacobson Ren Robert and Jacobson Rachelle L
Bought by
The Ren And Rachelle Jacobson Family Tru and Jacobson Rachelle Lydia
Create a Home Valuation Report for This Property
The Home Valuation Report is an in-depth analysis detailing your home's value as well as a comparison with similar homes in the area
Home Values in the Area
Average Home Value in this Area
Purchase History
| Date | Buyer | Sale Price | Title Company |
|---|---|---|---|
| Lacefield Christopher | -- | -- | |
| The Ren And Rachelle Jacobson Family Tru | -- | None Available |
Source: Public Records
Mortgage History
| Date | Status | Borrower | Loan Amount |
|---|---|---|---|
| Open | Lacefield Christopher | $180,667 | |
| Closed | Lacefield Christopher | -- |
Source: Public Records
Tax History Compared to Growth
Tax History
| Year | Tax Paid | Tax Assessment Tax Assessment Total Assessment is a certain percentage of the fair market value that is determined by local assessors to be the total taxable value of land and additions on the property. | Land | Improvement |
|---|---|---|---|---|
| 2025 | $2,556 | $404,127 | $120,026 | $284,101 |
| 2024 | $2,352 | $204,599 | $66,014 | $138,585 |
| 2023 | $2,149 | $185,900 | $65,864 | $120,036 |
| 2022 | $2,313 | $207,900 | $57,758 | $150,142 |
| 2021 | $1,883 | $277,000 | $75,002 | $201,998 |
| 2020 | $1,815 | $246,000 | $75,002 | $170,998 |
| 2019 | $1,729 | $220,000 | $44,976 | $175,024 |
| 2018 | $1,596 | $190,000 | $40,002 | $149,998 |
| 2017 | $1,525 | $170,000 | $37,050 | $132,950 |
| 2016 | $1,352 | $79,950 | $16,499 | $63,451 |
| 2015 | $1,208 | $72,371 | $16,499 | $55,872 |
| 2014 | $1,218 | $72,371 | $16,499 | $55,872 |
Source: Public Records
Map
Nearby Homes