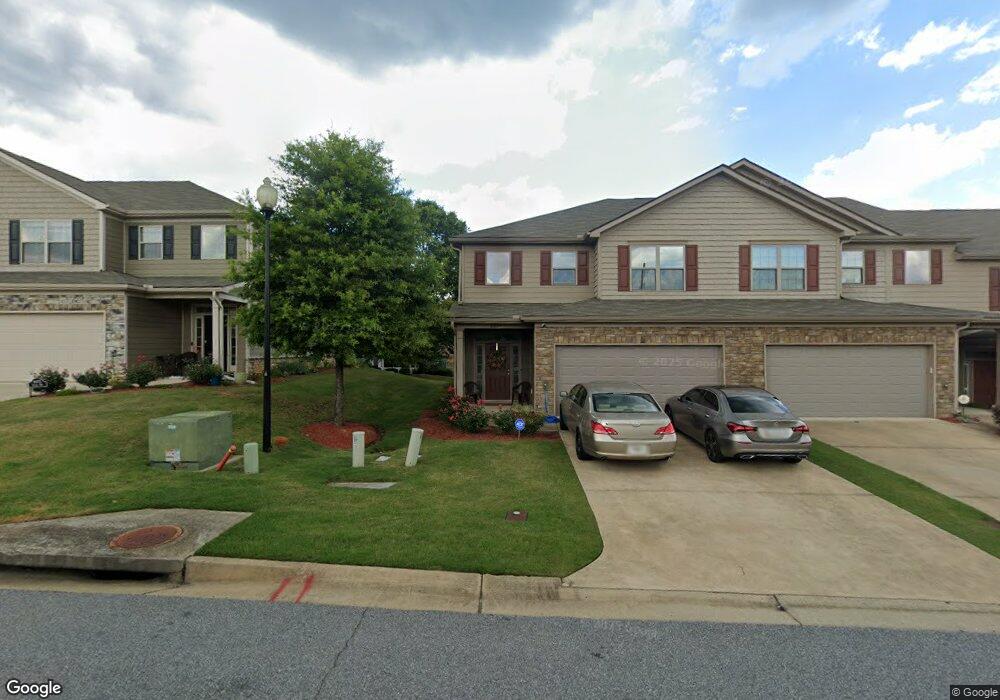
6075 Townes Way Columbus, GA 31909
Midland NeighborhoodEstimated Value: $256,767 - $264,000
3
Beds
3
Baths
1,996
Sq Ft
$130/Sq Ft
Est. Value
About This Home
This home is located at 6075 Townes Way, Columbus, GA 31909 and is currently estimated at $260,192, approximately $130 per square foot. 6075 Townes Way is a home located in Muscogee County with nearby schools including Midland Academy, Blackmon Road Middle School, and Shaw High School.
Ownership History
Date
Name
Owned For
Owner Type
Purchase Details
Closed on
Jul 16, 2021
Sold by
Lad Mehul
Bought by
Ssn Properties One Llc
Current Estimated Value
Home Financials for this Owner
Home Financials are based on the most recent Mortgage that was taken out on this home.
Original Mortgage
$824,000
Outstanding Balance
$487,215
Interest Rate
2.93%
Mortgage Type
New Conventional
Estimated Equity
-$227,023
Purchase Details
Closed on
Mar 11, 2021
Sold by
Ash-Grayhawk Llc
Bought by
Lad Mehul Jekishan and Lad Ashwiniben Mehul
Purchase Details
Closed on
Feb 27, 2020
Sold by
Peterman Ebony
Bought by
Lad Mehul and Patel Ambrish A
Purchase Details
Closed on
Aug 27, 2015
Sold by
Grayhawk Townhomes Inc
Bought by
Peterman Ebony
Home Financials for this Owner
Home Financials are based on the most recent Mortgage that was taken out on this home.
Original Mortgage
$188,271
Interest Rate
4.02%
Mortgage Type
VA
Purchase Details
Closed on
Apr 20, 2015
Sold by
Tiger Creek Development In
Bought by
Grayhawk Townhomes Inc
Create a Home Valuation Report for This Property
The Home Valuation Report is an in-depth analysis detailing your home's value as well as a comparison with similar homes in the area
Home Values in the Area
Average Home Value in this Area
Purchase History
| Date | Buyer | Sale Price | Title Company |
|---|---|---|---|
| Ssn Properties One Llc | -- | -- | |
| Lad Mehul Jekishan | -- | None Listed On Document | |
| Lad Mehul | $182,000 | -- | |
| Peterman Ebony | $184,309 | -- | |
| Grayhawk Townhomes Inc | $150,000 | -- |
Source: Public Records
Mortgage History
| Date | Status | Borrower | Loan Amount |
|---|---|---|---|
| Open | Ssn Properties One Llc | $824,000 | |
| Previous Owner | Peterman Ebony | $188,271 |
Source: Public Records
Tax History Compared to Growth
Tax History
| Year | Tax Paid | Tax Assessment Tax Assessment Total Assessment is a certain percentage of the fair market value that is determined by local assessors to be the total taxable value of land and additions on the property. | Land | Improvement |
|---|---|---|---|---|
| 2025 | $394 | $100,700 | $12,900 | $87,800 |
| 2024 | $394 | $100,700 | $12,900 | $87,800 |
| 2023 | $3,967 | $100,700 | $12,900 | $87,800 |
| 2022 | $3,530 | $86,448 | $12,900 | $73,548 |
| 2021 | $2,950 | $72,248 | $12,900 | $59,348 |
| 2020 | $2,480 | $60,724 | $12,900 | $47,824 |
| 2019 | $2,488 | $60,724 | $12,900 | $47,824 |
| 2018 | $2,488 | $60,724 | $12,900 | $47,824 |
| 2017 | $2,496 | $60,724 | $12,900 | $47,824 |
| 2016 | $3,036 | $73,600 | $12,000 | $61,600 |
| 2015 | $165 | $10,000 | $10,000 | $0 |
Source: Public Records
Map
Nearby Homes
- 6036 Townes Way
- 6055 Townes Way
- 8042 Sonoma Pointe Dr
- 7056 Stoneybrook Dr
- 7076 Stoneybrook Dr
- 7020 Stoneridge Cir
- 8095 Santee Ct
- 7389 Sorrel Ct
- 6454 Patriot Dr
- 6528 Yellow Stone Ct
- 6222 Goodwin Dr
- 6 Jamestown Ct
- 209 Plum Ct
- 7101 Cross Tie Dr
- 7168 Pinewood Ct
- 5045 Old Post Rd
- 5042 Foxfire Dr
- 5041 Montego Dr
- 5422 Colony Dr
- 5135 Midland Trace
- 6077 Townes Way
- 6079 Townes Way
- 6073 Townes Way
- 6081 Townes Way
- 6071 Townes Way
- 6083 Townes Way
- 6069 Townes Way
- 6076 Townes Way
- 6085 Townes Way
- 6067 Townes Way
- 6072 Townes Way
- 6058 Townes Way
- 6065 Townes Way
- 6087 Townes Way
- 6068 Townes Way
- 6078 Townes Way
- 6054 Townes Way
- 6091 Townes Way
- 6074 Townes Way
- 6050 Townes Way