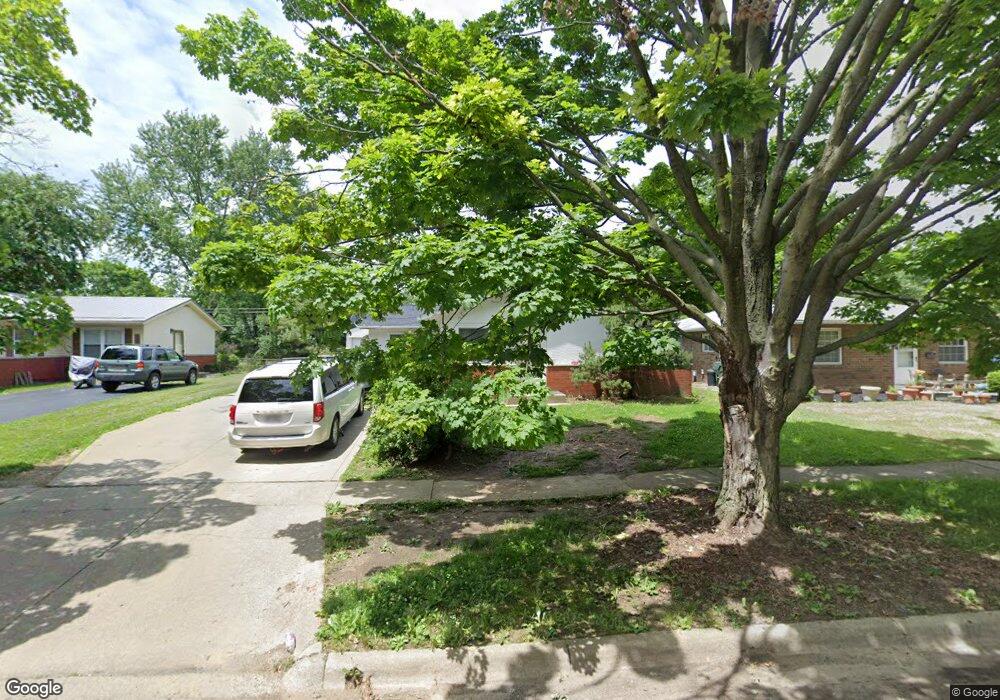
6077 Northgap Dr Unit 79 Columbus, OH 43229
Devonshire NeighborhoodEstimated Value: $278,844 - $318,000
5
Beds
2
Baths
1,536
Sq Ft
$193/Sq Ft
Est. Value
About This Home
This home is located at 6077 Northgap Dr Unit 79, Columbus, OH 43229 and is currently estimated at $297,211, approximately $193 per square foot. 6077 Northgap Dr Unit 79 is a home located in Franklin County with nearby schools including Devonshire Alternative Elementary School, Woodward Park Middle School, and Beechcroft High School.
Ownership History
Date
Name
Owned For
Owner Type
Purchase Details
Closed on
May 9, 2016
Sold by
Bringardner Jeffrey F and Bringardner Jane Z
Bought by
Bringardner Jeffrey F and Bringardner Jane Z
Current Estimated Value
Purchase Details
Closed on
Mar 15, 2004
Sold by
Arnold Terry Gene
Bought by
Bringardner Jeffrey F and Bringardner Jane Z
Home Financials for this Owner
Home Financials are based on the most recent Mortgage that was taken out on this home.
Original Mortgage
$110,000
Interest Rate
5.78%
Mortgage Type
Purchase Money Mortgage
Purchase Details
Closed on
Aug 28, 2002
Sold by
Arnold Gene C
Bought by
Arnold Gene C and The Gene C Arnold Revocable Trust
Purchase Details
Closed on
Jun 21, 2000
Sold by
Estate Of Donna J Arnold
Bought by
Arnold Gene C
Purchase Details
Closed on
Dec 1, 1966
Bought by
Arnold Gene C
Create a Home Valuation Report for This Property
The Home Valuation Report is an in-depth analysis detailing your home's value as well as a comparison with similar homes in the area
Home Values in the Area
Average Home Value in this Area
Purchase History
| Date | Buyer | Sale Price | Title Company |
|---|---|---|---|
| Bringardner Jeffrey F | -- | None Available | |
| Bringardner Jeffrey F | $100,000 | Chicago Title | |
| Arnold Gene C | -- | -- | |
| Arnold Gene C | -- | -- | |
| Arnold Gene C | -- | -- |
Source: Public Records
Mortgage History
| Date | Status | Borrower | Loan Amount |
|---|---|---|---|
| Closed | Bringardner Jeffrey F | $110,000 |
Source: Public Records
Tax History Compared to Growth
Tax History
| Year | Tax Paid | Tax Assessment Tax Assessment Total Assessment is a certain percentage of the fair market value that is determined by local assessors to be the total taxable value of land and additions on the property. | Land | Improvement |
|---|---|---|---|---|
| 2024 | $3,582 | $78,160 | $17,500 | $60,660 |
| 2023 | $3,537 | $78,160 | $17,500 | $60,660 |
| 2022 | $2,260 | $42,530 | $9,450 | $33,080 |
| 2021 | $2,476 | $42,530 | $9,450 | $33,080 |
| 2020 | $2,268 | $42,530 | $9,450 | $33,080 |
| 2019 | $2,115 | $34,020 | $7,560 | $26,460 |
| 2018 | $2,252 | $34,020 | $7,560 | $26,460 |
| 2017 | $2,344 | $34,020 | $7,560 | $26,460 |
| 2016 | $2,573 | $37,880 | $7,670 | $30,210 |
| 2015 | $2,393 | $37,880 | $7,670 | $30,210 |
| 2014 | $2,349 | $37,880 | $7,670 | $30,210 |
| 2013 | $1,337 | $42,070 | $8,505 | $33,565 |
Source: Public Records
Map
Nearby Homes
- 1171 Newbury Dr
- 6189 Northgap Dr
- 6211 Parkdale Dr
- 1288 Oakfield Dr N
- 5990 Ambleside Dr
- 1460 Burnley Square N
- 6035 Karl Rd
- 1268 Kildale Ct
- 5674 Lindenwood Rd
- 1549 Alpine Dr
- 1492 Cottonwood Dr
- 5548 Roche Dr
- 5579 Norcross Rd
- 6407 Faircrest Rd
- 1409 Bosworth Place
- 1421 Bosworth Place
- 6342 Bellmeadow Dr
- 1752 Pine Tree St S Unit H
- 1687 Brookfield Square S
- 5480 Rockwood Ct Unit R1
- 6085-6087 Northgap Dr
- 6085 Northgap Dr Unit 87
- 6069 Northgap Dr Unit 71
- 6093 Northgap Dr Unit 95
- 1176 Sanborn Place Unit A
- 1176 Sanborn Place Unit D
- 1190 Sanborn Place Unit 192
- 1178 Sanborn Place Unit D
- 1178 Sanborn Place Unit B
- 1190-1192 Sanborn Place
- 6078 Northgap Dr
- 6070 Northgap Dr
- 1177 Newbury Dr
- 1187-1189 Newbury Dr
- 1187 Newbury Dr Unit 189
- 6062 Northgap Dr
- 6086 Northgap Dr
- 1174 Sanborn Place Unit B
- 1182 Sanborn Place Unit B
- 1211 Newbury Dr