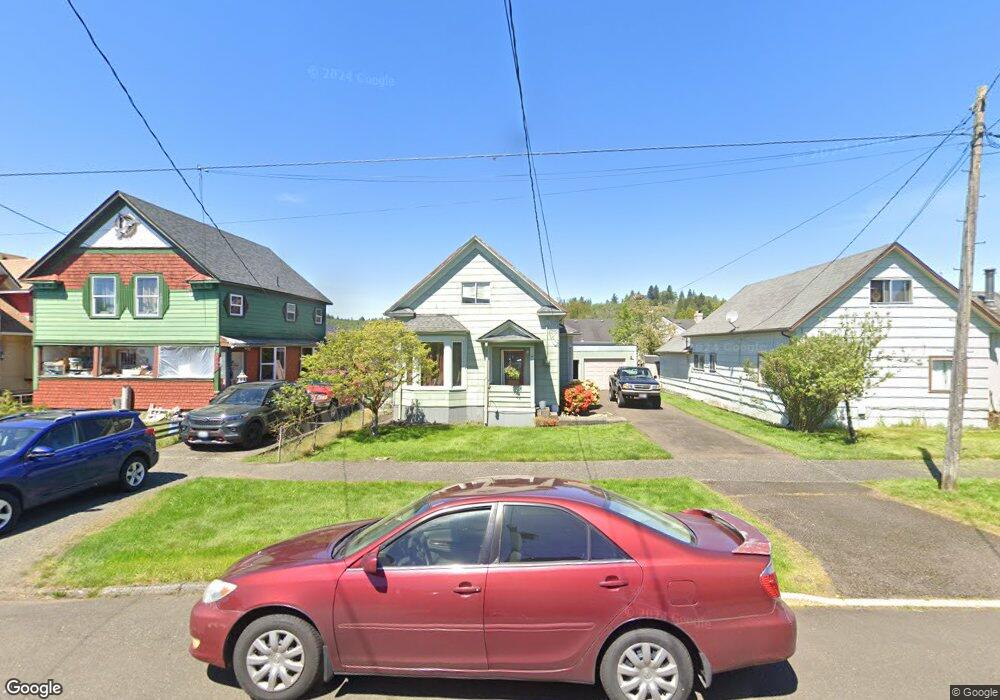
608 2nd St Hoquiam, WA 98550
Estimated Value: $199,000 - $225,000
2
Beds
1
Bath
1,183
Sq Ft
$182/Sq Ft
Est. Value
About This Home
This home is located at 608 2nd St, Hoquiam, WA 98550 and is currently estimated at $214,951, approximately $181 per square foot. 608 2nd St is a home located in Grays Harbor County with nearby schools including Emerson Elementary School, Lincoln Elementary School, and Central Elementary School.
Ownership History
Date
Name
Owned For
Owner Type
Purchase Details
Closed on
Jul 28, 2008
Sold by
Ashlock Shannon R
Bought by
Ashlock Shannon R and Madison Gregory
Current Estimated Value
Home Financials for this Owner
Home Financials are based on the most recent Mortgage that was taken out on this home.
Original Mortgage
$99,470
Outstanding Balance
$65,413
Interest Rate
6.37%
Mortgage Type
FHA
Estimated Equity
$149,538
Purchase Details
Closed on
Aug 9, 2006
Sold by
Pumphrey Steven Charles and Pumphrey Ray Michael
Bought by
Ashlock Shannon R
Home Financials for this Owner
Home Financials are based on the most recent Mortgage that was taken out on this home.
Original Mortgage
$85,000
Interest Rate
10.02%
Mortgage Type
Adjustable Rate Mortgage/ARM
Create a Home Valuation Report for This Property
The Home Valuation Report is an in-depth analysis detailing your home's value as well as a comparison with similar homes in the area
Home Values in the Area
Average Home Value in this Area
Purchase History
| Date | Buyer | Sale Price | Title Company |
|---|---|---|---|
| Ashlock Shannon R | -- | Ticor Title | |
| Ashlock Shannon R | $85,000 | Coast Title |
Source: Public Records
Mortgage History
| Date | Status | Borrower | Loan Amount |
|---|---|---|---|
| Open | Ashlock Shannon R | $99,470 | |
| Closed | Ashlock Shannon R | $85,000 |
Source: Public Records
Tax History Compared to Growth
Tax History
| Year | Tax Paid | Tax Assessment Tax Assessment Total Assessment is a certain percentage of the fair market value that is determined by local assessors to be the total taxable value of land and additions on the property. | Land | Improvement |
|---|---|---|---|---|
| 2025 | $1,400 | $148,573 | $22,500 | $126,073 |
| 2023 | $1,554 | $124,516 | $22,500 | $102,016 |
| 2022 | $1,461 | $114,930 | $14,062 | $100,868 |
| 2021 | $1,282 | $114,930 | $14,062 | $100,868 |
| 2020 | $1,136 | $94,756 | $14,062 | $80,694 |
| 2019 | $934 | $81,307 | $14,062 | $67,245 |
| 2018 | $936 | $70,100 | $14,062 | $56,038 |
| 2017 | $892 | $58,892 | $14,062 | $44,830 |
| 2016 | $935 | $58,892 | $14,062 | $44,830 |
| 2014 | -- | $62,143 | $14,063 | $48,080 |
| 2013 | -- | $62,717 | $14,062 | $48,655 |
Source: Public Records
Map
Nearby Homes