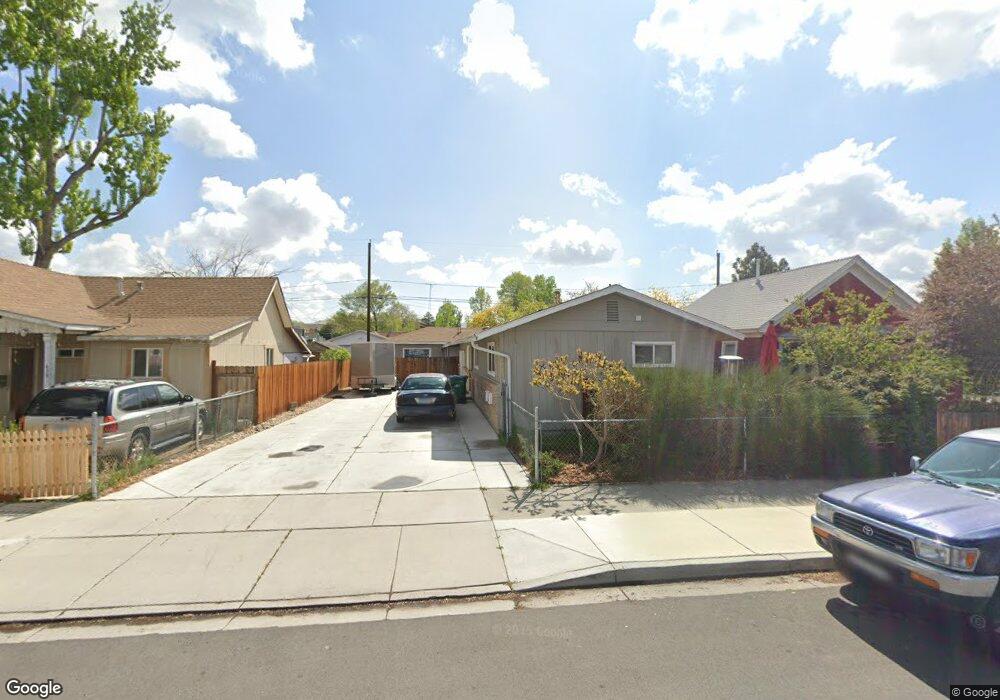
608 7th St Sparks, NV 89431
Downtown Sparks NeighborhoodEstimated Value: $433,000 - $617,000
5
Beds
2
Baths
1,768
Sq Ft
$281/Sq Ft
Est. Value
About This Home
This home is located at 608 7th St, Sparks, NV 89431 and is currently estimated at $497,246, approximately $281 per square foot. 608 7th St is a home located in Washoe County with nearby schools including Lincoln Park Elementary School, George L Dilworth Middle School, and Sparks High School.
Ownership History
Date
Name
Owned For
Owner Type
Purchase Details
Closed on
Jul 22, 2011
Sold by
Secretary Of Housing & Urban Development
Bought by
Jones Clinton J and Pyne Dolores
Current Estimated Value
Home Financials for this Owner
Home Financials are based on the most recent Mortgage that was taken out on this home.
Original Mortgage
$64,199
Outstanding Balance
$43,742
Interest Rate
4.46%
Mortgage Type
New Conventional
Estimated Equity
$453,504
Purchase Details
Closed on
Feb 28, 2011
Sold by
James B Nutter & Company
Bought by
Secretary Of Housing & Urban Development
Purchase Details
Closed on
Oct 8, 2010
Sold by
Legaux Stanley M
Bought by
James B Nutter & Company
Purchase Details
Closed on
Aug 13, 2001
Sold by
Vanguilder Alan D and Vanguilder Nanette
Bought by
Legaux Stanley M
Home Financials for this Owner
Home Financials are based on the most recent Mortgage that was taken out on this home.
Original Mortgage
$152,347
Interest Rate
7.1%
Mortgage Type
FHA
Create a Home Valuation Report for This Property
The Home Valuation Report is an in-depth analysis detailing your home's value as well as a comparison with similar homes in the area
Home Values in the Area
Average Home Value in this Area
Purchase History
| Date | Buyer | Sale Price | Title Company |
|---|---|---|---|
| Jones Clinton J | $86,000 | Western Title Company | |
| Secretary Of Housing & Urban Development | $157,645 | Lsi Title Agency Inc | |
| James B Nutter & Company | $157,645 | Lsi Title Agency Inc | |
| Legaux Stanley M | $154,500 | First Centennial Title Co |
Source: Public Records
Mortgage History
| Date | Status | Borrower | Loan Amount |
|---|---|---|---|
| Open | Jones Clinton J | $64,199 | |
| Previous Owner | Legaux Stanley M | $152,347 |
Source: Public Records
Tax History
| Year | Tax Paid | Tax Assessment Tax Assessment Total Assessment is a certain percentage of the fair market value that is determined by local assessors to be the total taxable value of land and additions on the property. | Land | Improvement |
|---|---|---|---|---|
| 2026 | $846 | $64,645 | $40,880 | $23,765 |
| 2024 | $936 | $57,784 | $38,710 | $19,074 |
| 2023 | $909 | $55,744 | $39,305 | $16,439 |
| 2022 | $842 | $46,803 | $32,865 | $13,938 |
| 2021 | $818 | $39,043 | $25,375 | $13,668 |
| 2020 | $768 | $39,711 | $26,250 | $13,461 |
| 2019 | $731 | $35,242 | $22,470 | $12,772 |
| 2018 | $699 | $27,454 | $15,190 | $12,264 |
| 2017 | $670 | $25,937 | $14,000 | $11,937 |
| 2016 | $653 | $23,081 | $11,200 | $11,881 |
| 2015 | $652 | $19,955 | $8,050 | $11,905 |
| 2014 | $632 | $18,102 | $7,000 | $11,102 |
| 2013 | -- | $16,863 | $6,160 | $10,703 |
Source: Public Records
Map
Nearby Homes
Your Personal Tour Guide
Ask me questions while you tour the home.