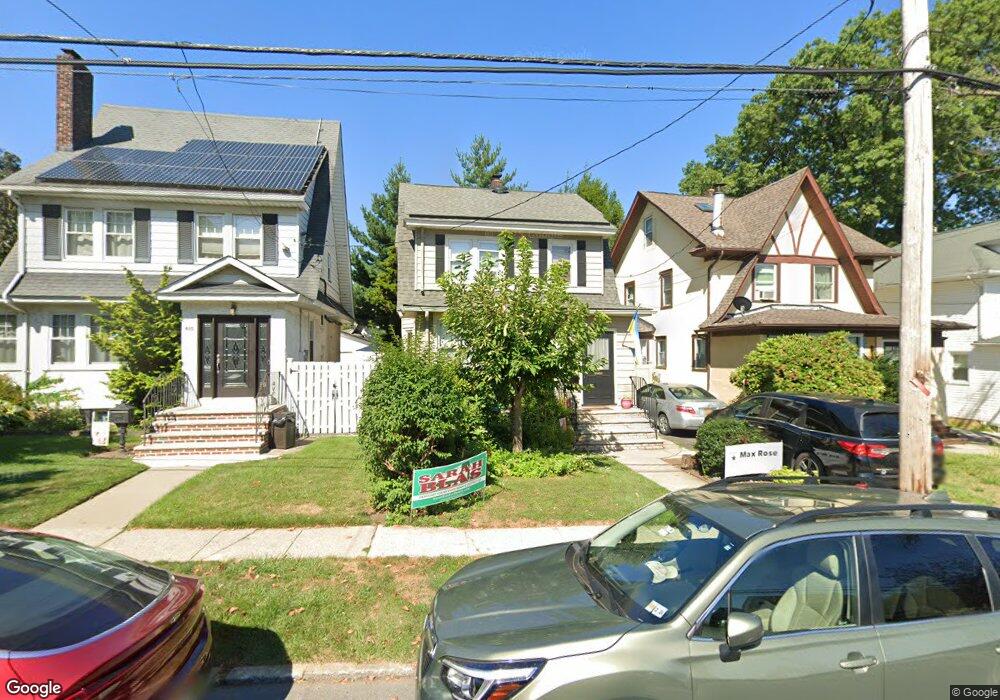
608 Bement Ave Staten Island, NY 10310
West Brighton NeighborhoodEstimated Value: $670,000 - $800,000
3
Beds
2
Baths
1,280
Sq Ft
$558/Sq Ft
Est. Value
About This Home
This home is located at 608 Bement Ave, Staten Island, NY 10310 and is currently estimated at $714,774, approximately $558 per square foot. 608 Bement Ave is a home located in Richmond County with nearby schools including P.S. 45 John Tyler, Intermediate School 27, and Curtis High School.
Ownership History
Date
Name
Owned For
Owner Type
Purchase Details
Closed on
Aug 9, 2011
Sold by
Kenniebrew Lawrence and Kenniebrew Melodie
Bought by
Rossi Celia
Current Estimated Value
Home Financials for this Owner
Home Financials are based on the most recent Mortgage that was taken out on this home.
Original Mortgage
$375,240
Outstanding Balance
$258,962
Interest Rate
4.5%
Mortgage Type
FHA
Estimated Equity
$455,812
Purchase Details
Closed on
Mar 26, 2001
Sold by
Clifford Brian and Clifford Victoria
Bought by
Kenniebrew Living Trust
Home Financials for this Owner
Home Financials are based on the most recent Mortgage that was taken out on this home.
Original Mortgage
$190,000
Interest Rate
6.9%
Purchase Details
Closed on
Aug 20, 1998
Sold by
Kyle Thomas S and Kyle Rosemary
Bought by
Clifford Brian and Clifford Victoria
Home Financials for this Owner
Home Financials are based on the most recent Mortgage that was taken out on this home.
Original Mortgage
$172,000
Interest Rate
6.9%
Create a Home Valuation Report for This Property
The Home Valuation Report is an in-depth analysis detailing your home's value as well as a comparison with similar homes in the area
Home Values in the Area
Average Home Value in this Area
Purchase History
| Date | Buyer | Sale Price | Title Company |
|---|---|---|---|
| Rossi Celia | $385,000 | The Judicial Title Insurance | |
| Kenniebrew Living Trust | $260,000 | Washington Title Insurance C | |
| Clifford Brian | $215,000 | -- |
Source: Public Records
Mortgage History
| Date | Status | Borrower | Loan Amount |
|---|---|---|---|
| Open | Rossi Celia | $375,240 | |
| Previous Owner | Kenniebrew Living Trust | $190,000 | |
| Previous Owner | Clifford Brian | $172,000 |
Source: Public Records
Tax History Compared to Growth
Tax History
| Year | Tax Paid | Tax Assessment Tax Assessment Total Assessment is a certain percentage of the fair market value that is determined by local assessors to be the total taxable value of land and additions on the property. | Land | Improvement |
|---|---|---|---|---|
| 2025 | $5,939 | $40,260 | $9,393 | $30,867 |
| 2024 | $5,951 | $42,960 | $8,305 | $34,655 |
| 2023 | $5,588 | $29,220 | $8,226 | $20,994 |
| 2022 | $5,546 | $40,800 | $11,520 | $29,280 |
| 2021 | $5,799 | $40,140 | $11,520 | $28,620 |
| 2020 | $5,494 | $36,120 | $11,520 | $24,600 |
| 2019 | $5,106 | $34,140 | $11,520 | $22,620 |
| 2018 | $4,666 | $24,350 | $8,722 | $15,628 |
| 2017 | $4,664 | $24,350 | $9,720 | $14,630 |
| 2016 | $4,521 | $24,164 | $9,468 | $14,696 |
| 2015 | $3,823 | $22,797 | $9,813 | $12,984 |
| 2014 | $3,823 | $21,508 | $11,119 | $10,389 |
Source: Public Records
Map
Nearby Homes
- 152 Harvest Ave
- 677 Bement Ave
- 100 Lawrence Ave
- 710 Oakland Ave
- 34 Harvest Ave
- 706 Broadway
- 751 Oakland Ave
- 20 Baker Place
- 605 Bard Ave
- 1 Whitewood Ave
- 12 Freeman Place
- 54 City Blvd
- 0 Hardin Ave
- 54 Purcell St
- 432 Pelton Ave
- 145 Norma Place
- 386 N Burgher Ave
- 967 Bard Ave
- 1 Sunset Hill Dr
- 64 Greenway Dr
- 604 Bement Ave
- 610 Bement Ave
- 9 Bosworth St
- 600 Bement Ave
- 11 Bosworth St
- 596 Bement Ave
- 614 Bement Ave
- 180 Harvest Ave
- 15 Bosworth St
- 590 Bement Ave
- 616 Bement Ave
- 184 Harvest Ave
- 8 Bosworth St
- 620 Bement Ave
- 603 Bement Ave
- 599 Bement Ave
- 10 Bosworth St
- 188 Harvest Ave
- 19 Bosworth St
- 595 Bement Ave