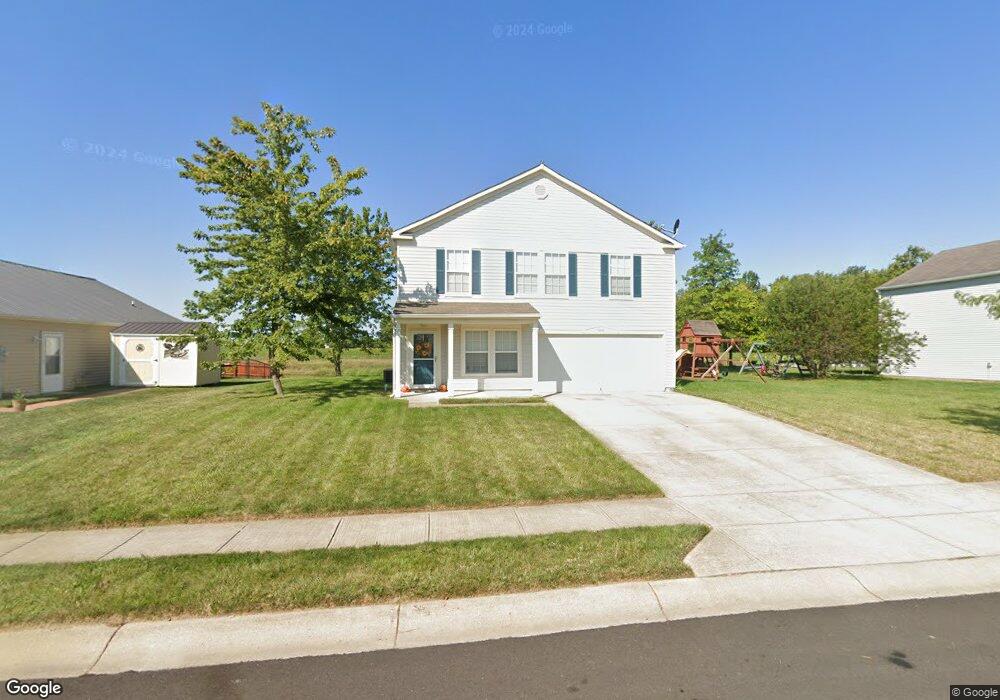
608 Bow St Sheridan, IN 46069
Estimated Value: $293,000 - $316,000
3
Beds
3
Baths
2,138
Sq Ft
$141/Sq Ft
Est. Value
About This Home
This home is located at 608 Bow St, Sheridan, IN 46069 and is currently estimated at $302,290, approximately $141 per square foot. 608 Bow St is a home located in Hamilton County with nearby schools including Sheridan Elementary School, Sheridan Middle School, and Sheridan High School.
Ownership History
Date
Name
Owned For
Owner Type
Purchase Details
Closed on
Jan 31, 2008
Sold by
C P Morgan Communities Lp
Bought by
Gainey Joseph D
Current Estimated Value
Purchase Details
Closed on
Dec 31, 2007
Sold by
Collins Jay L and Collins Gail M
Bought by
C P Morgan Communities Lp
Purchase Details
Closed on
Mar 8, 2006
Sold by
R & B Developers Inc
Bought by
Collins Jay L and Collins Gail M
Home Financials for this Owner
Home Financials are based on the most recent Mortgage that was taken out on this home.
Original Mortgage
$846,375
Interest Rate
6.38%
Mortgage Type
Purchase Money Mortgage
Create a Home Valuation Report for This Property
The Home Valuation Report is an in-depth analysis detailing your home's value as well as a comparison with similar homes in the area
Home Values in the Area
Average Home Value in this Area
Purchase History
| Date | Buyer | Sale Price | Title Company |
|---|---|---|---|
| Gainey Joseph D | -- | Hts | |
| C P Morgan Communities Lp | -- | Hts | |
| Collins Jay L | -- | None Available |
Source: Public Records
Mortgage History
| Date | Status | Borrower | Loan Amount |
|---|---|---|---|
| Previous Owner | Collins Jay L | $846,375 |
Source: Public Records
Tax History Compared to Growth
Tax History
| Year | Tax Paid | Tax Assessment Tax Assessment Total Assessment is a certain percentage of the fair market value that is determined by local assessors to be the total taxable value of land and additions on the property. | Land | Improvement |
|---|---|---|---|---|
| 2024 | $2,662 | $235,400 | $39,000 | $196,400 |
| 2023 | $2,697 | $237,700 | $39,000 | $198,700 |
| 2022 | $2,168 | $189,800 | $39,000 | $150,800 |
| 2021 | $1,930 | $169,300 | $39,000 | $130,300 |
| 2020 | $1,784 | $156,700 | $39,000 | $117,700 |
| 2019 | $1,625 | $143,100 | $18,100 | $125,000 |
| 2018 | $1,501 | $132,400 | $18,100 | $114,300 |
| 2017 | $1,298 | $114,900 | $18,100 | $96,800 |
| 2016 | $1,294 | $117,000 | $18,100 | $98,900 |
| 2014 | $1,277 | $119,100 | $27,300 | $91,800 |
| 2013 | $1,277 | $111,300 | $27,300 | $84,000 |
Source: Public Records
Map
Nearby Homes
- 511 Tomahawk St
- 3936 W State Road 47
- 1224 Maple Trace Way
- 1102 Maple Run Dr
- 1134 Maple Trace Way
- 1300 Shadetree Ln
- 1225 Maple Trace Way
- 413 Shadetree Ct
- 1439 Willow Tree Ln
- Spruce Plan at Maple Run
- Chestnut Plan at Maple Run
- Juniper Plan at Maple Run
- Empress Plan at Maple Run
- Aspen II Plan at Maple Run
- Ironwood Plan at Maple Run
- Bradford Plan at Maple Run
- Walnut Plan at Maple Run
- Ashton Plan at Maple Run
- Palmetto Plan at Maple Run
- Cooper Plan at Maple Run