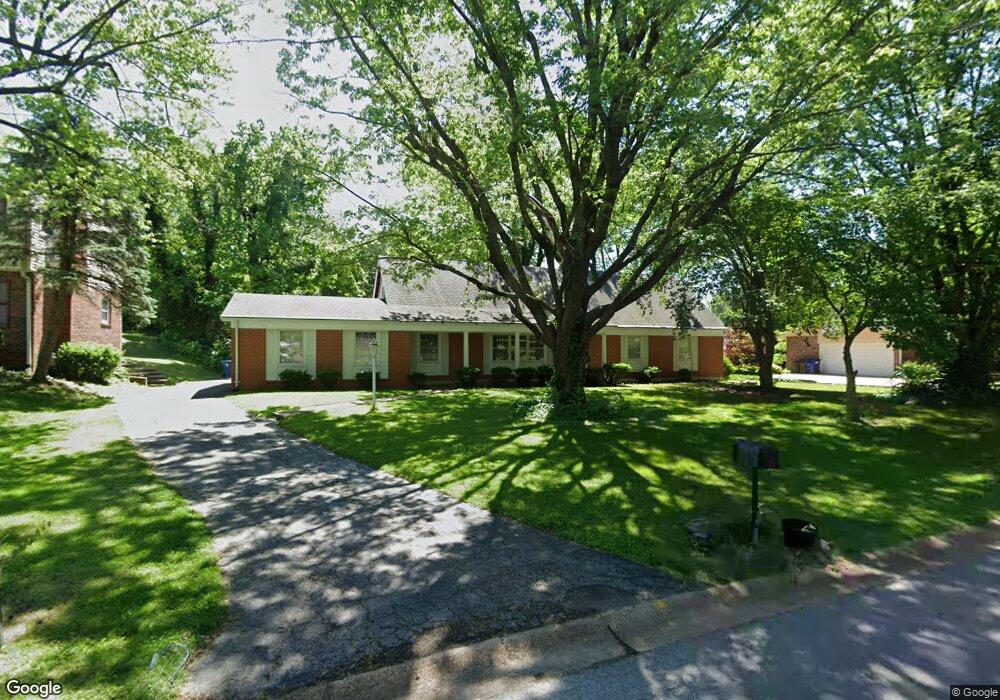
608 Chartier Dr Saint Louis, MO 63135
Estimated Value: $242,701 - $310,000
6
Beds
3
Baths
2,088
Sq Ft
$129/Sq Ft
Est. Value
About This Home
This home is located at 608 Chartier Dr, Saint Louis, MO 63135 and is currently estimated at $268,425, approximately $128 per square foot. 608 Chartier Dr is a home located in St. Louis County with nearby schools including Lee Hamilton Elementary School, Ferguson Middle School, and McCluer High School.
Ownership History
Date
Name
Owned For
Owner Type
Purchase Details
Closed on
Apr 25, 2008
Sold by
Lasalle Bank Na
Bought by
Savage Marvin G
Current Estimated Value
Home Financials for this Owner
Home Financials are based on the most recent Mortgage that was taken out on this home.
Original Mortgage
$81,450
Outstanding Balance
$51,299
Interest Rate
5.86%
Mortgage Type
Purchase Money Mortgage
Estimated Equity
$217,127
Purchase Details
Closed on
Nov 6, 2007
Sold by
Austell Michael R
Bought by
Lasalle Bank Na and First Franklin Mortgage Loan Trust 2007-
Purchase Details
Closed on
Nov 29, 2006
Sold by
Stroot Frank H and Stroot Clara M
Bought by
Austell Michael R
Home Financials for this Owner
Home Financials are based on the most recent Mortgage that was taken out on this home.
Original Mortgage
$188,000
Interest Rate
6.41%
Mortgage Type
Stand Alone First
Create a Home Valuation Report for This Property
The Home Valuation Report is an in-depth analysis detailing your home's value as well as a comparison with similar homes in the area
Home Values in the Area
Average Home Value in this Area
Purchase History
| Date | Buyer | Sale Price | Title Company |
|---|---|---|---|
| Savage Marvin G | $150,000 | None Available | |
| Lasalle Bank Na | $199,254 | None Available | |
| Austell Michael R | $235,000 | None Available |
Source: Public Records
Mortgage History
| Date | Status | Borrower | Loan Amount |
|---|---|---|---|
| Open | Savage Marvin G | $81,450 | |
| Previous Owner | Austell Michael R | $188,000 | |
| Closed | Lasalle Bank Na | -- |
Source: Public Records
Tax History
| Year | Tax Paid | Tax Assessment Tax Assessment Total Assessment is a certain percentage of the fair market value that is determined by local assessors to be the total taxable value of land and additions on the property. | Land | Improvement |
|---|---|---|---|---|
| 2025 | $3,091 | $49,350 | $7,850 | $41,500 |
| 2024 | $3,091 | $42,980 | $3,930 | $39,050 |
| 2023 | $3,074 | $42,980 | $3,930 | $39,050 |
| 2022 | $2,813 | $34,260 | $5,110 | $29,150 |
| 2021 | $2,722 | $34,260 | $5,110 | $29,150 |
| 2020 | $2,656 | $30,040 | $5,870 | $24,170 |
| 2019 | $2,605 | $30,040 | $5,870 | $24,170 |
| 2018 | $2,686 | $27,640 | $3,590 | $24,050 |
| 2017 | $2,633 | $27,640 | $3,590 | $24,050 |
| 2016 | $2,401 | $24,780 | $3,990 | $20,790 |
Source: Public Records
Map
Nearby Homes
- 3652 Knollstone Dr
- 7 Bromley Dr
- 35 E Cardigan Dr
- 6 Sandringham Ln
- 62 W Cardigan Dr
- 1536 Springlet Ct Unit 31
- 1530 Springlet Ct Unit 14
- 1051 Smith Ave
- 820 N Elizabeth Ave
- 1514 Summer Run Dr Unit 308
- 1606 Willow Wren Ct Unit 305
- 705 Palace Ct
- 6 Cardigan Dr
- 1244 Hobson Dr
- 1233 Hudson Hills Dr
- 700 N Elizabeth Ave
- 847 N Florissant Rd
- 631 Robert Ave
- 16 White Dr
- 410 Robert Ave
- 616 Chartier Dr
- 604 Chartier Dr
- 609 Chartier Dr
- 624 Chartier Dr
- 619 Chartier Dr
- 523 Chartier Dr
- 600 Chartier Dr
- 703 Chateau Valley Ct
- 700 Chateau Valley Ct
- 625 Chartier Dr
- 509 Chartier Dr
- 632 Chartier Dr
- 528 Chartier Dr
- 514 Monceau Dr
- 707 Chateau Valley Ct
- 520 Monceau Dr
- 704 Chateau Valley Ct
- 633 Chartier Dr
- 522 Chartier Dr
- 1440 Alicia Ave
Your Personal Tour Guide
Ask me questions while you tour the home.