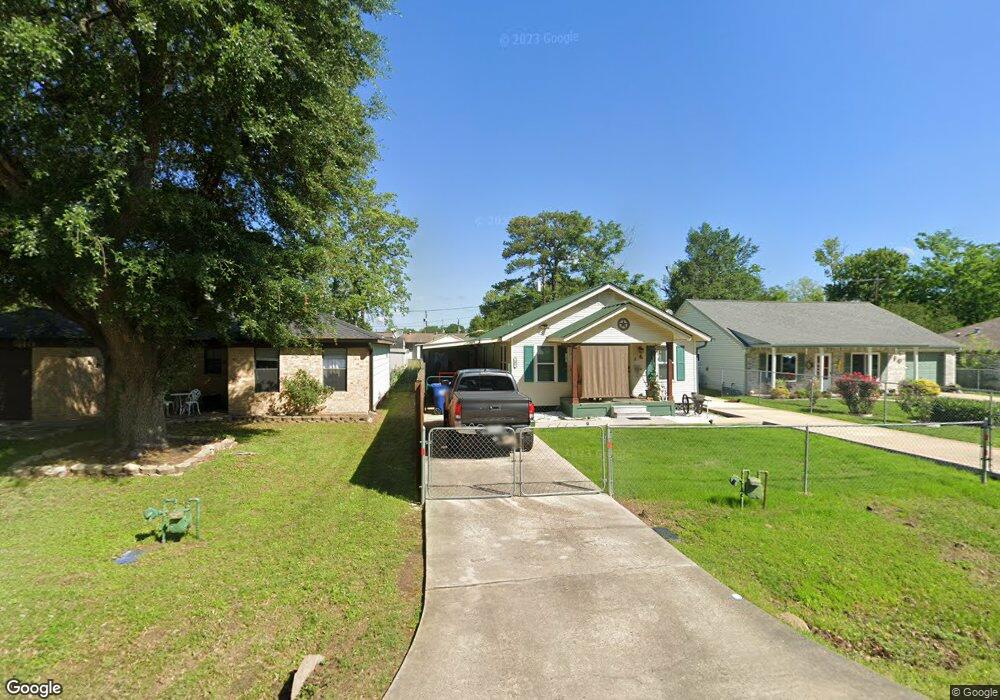
608 Clarence St Tomball, TX 77375
Estimated Value: $217,087 - $303,000
3
Beds
1
Bath
944
Sq Ft
$276/Sq Ft
Est. Value
About This Home
This home is located at 608 Clarence St, Tomball, TX 77375 and is currently estimated at $260,772, approximately $276 per square foot. 608 Clarence St is a home located in Harris County with nearby schools including Tomball Elementary School, Tomball Intermediate School, and Tomball Junior High School.
Ownership History
Date
Name
Owned For
Owner Type
Purchase Details
Closed on
Jul 31, 2012
Sold by
Dupriest Jan and Hamilton Jan L
Bought by
Hamilton Phillip B
Current Estimated Value
Purchase Details
Closed on
Aug 31, 2004
Sold by
Burns Jean and Garcia Alphonso
Bought by
Hamilton Jan L
Home Financials for this Owner
Home Financials are based on the most recent Mortgage that was taken out on this home.
Original Mortgage
$71,760
Interest Rate
8.99%
Mortgage Type
Purchase Money Mortgage
Purchase Details
Closed on
Mar 26, 2001
Sold by
Malito Janis Kay and Shelter Janis
Bought by
Burns Jean
Home Financials for this Owner
Home Financials are based on the most recent Mortgage that was taken out on this home.
Original Mortgage
$58,400
Interest Rate
6.98%
Create a Home Valuation Report for This Property
The Home Valuation Report is an in-depth analysis detailing your home's value as well as a comparison with similar homes in the area
Home Values in the Area
Average Home Value in this Area
Purchase History
| Date | Buyer | Sale Price | Title Company |
|---|---|---|---|
| Hamilton Phillip B | -- | None Available | |
| Hamilton Jan L | -- | American Title Co | |
| Burns Jean | -- | Alamo Title Company |
Source: Public Records
Mortgage History
| Date | Status | Borrower | Loan Amount |
|---|---|---|---|
| Previous Owner | Hamilton Jan L | $71,760 | |
| Previous Owner | Burns Jean | $58,400 | |
| Closed | Burns Jean | $10,950 | |
| Closed | Hamilton Jan L | $17,940 |
Source: Public Records
Tax History Compared to Growth
Tax History
| Year | Tax Paid | Tax Assessment Tax Assessment Total Assessment is a certain percentage of the fair market value that is determined by local assessors to be the total taxable value of land and additions on the property. | Land | Improvement |
|---|---|---|---|---|
| 2025 | $2,163 | $210,343 | $105,000 | $105,343 |
| 2024 | $2,163 | $204,015 | $98,000 | $106,015 |
| 2023 | $2,163 | $190,015 | $84,000 | $106,015 |
| 2022 | $3,483 | $154,518 | $63,000 | $91,518 |
| 2021 | $2,760 | $116,360 | $45,500 | $70,860 |
| 2020 | $2,690 | $109,672 | $35,000 | $74,672 |
| 2019 | $2,541 | $100,738 | $28,000 | $72,738 |
| 2018 | $1,350 | $100,738 | $28,000 | $72,738 |
| 2017 | $2,442 | $96,891 | $28,000 | $68,891 |
| 2016 | $2,283 | $90,591 | $28,000 | $62,591 |
| 2015 | $2,058 | $87,094 | $28,000 | $59,094 |
| 2014 | $2,058 | $80,835 | $28,000 | $52,835 |
Source: Public Records
Map
Nearby Homes
- 504 Percival St Unit A
- 505 Percival St
- 516 Clayton St
- TBD Clayton St
- 20734 Open Range Ct
- 18818 Cornelia Fields Ln
- 18723 Buttercup Farms Ln
- 20718 Open Range Ct
- 19951 Epona Creek Dr
- 19935 Epona Creek Dr
- 18707 Buttercup Farms Ln
- 18826 Cornelia Fields Ln
- 20714 Open Range Ct
- 204 Vernon St
- 200 S Vernon St
- 109 Mcphail St
- 0 N Sycamore St
- 16623 Farm To Market 2920
- 0 Fm-2920
- 1014 Graham Dr Unit A3
- 610 Clarence St
- 606 Clarence St
- 604 Clarence St
- 215 S Poplar St
- 611 Malone St
- 607 Malone St
- 605 Clarence St
- 207 S Poplar St
- 600 Clarence St
- 206 S Magnolia St
- 615 Malone St
- 603 Malone St
- 607 Clarence St
- 603 Clarence St
- 613 Clarence St
- 601 Clarence St
- 615 Clarence St
- 600 W Clarence
- 318 S Poplar St Unit 3
- 318 S Poplar St Unit 1