Estimated Value: $210,718 - $240,000
Studio
3
Baths
1,519
Sq Ft
$147/Sq Ft
Est. Value
About This Home
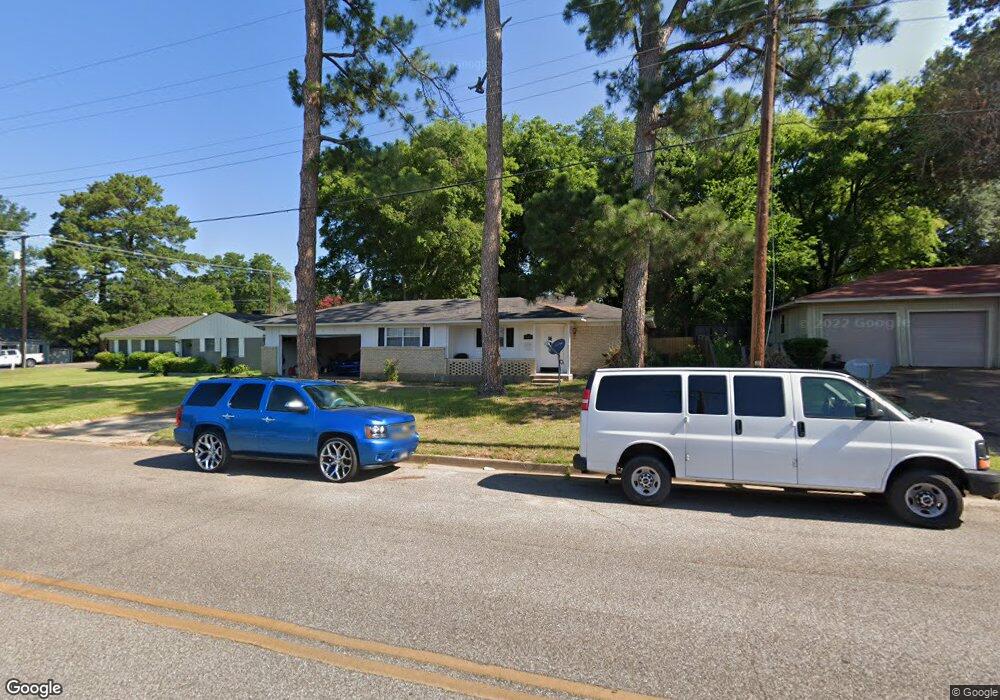
This home is located at 608 Clyde Dr, Tyler, TX 75701 and is currently estimated at $222,906, approximately $146 per square foot. 608 Clyde Dr is a home located in Smith County with nearby schools including Woods Elementary School, Hubbard Middle School, and Tyler Legacy High School.
Ownership History
Date
Name
Owned For
Owner Type
Purchase Details
Closed on
Jun 19, 2023
Sold by
Fraga David
Bought by
Tinyhead Llc
Current Estimated Value
Home Financials for this Owner
Home Financials are based on the most recent Mortgage that was taken out on this home.
Original Mortgage
$116,500
Outstanding Balance
$113,010
Interest Rate
6.39%
Mortgage Type
New Conventional
Estimated Equity
$109,896
Purchase Details
Closed on
Nov 20, 2020
Sold by
Fraga Hugo A and Fraga Huga A
Bought by
Fraga David
Home Financials for this Owner
Home Financials are based on the most recent Mortgage that was taken out on this home.
Original Mortgage
$130,000
Interest Rate
2.8%
Mortgage Type
New Conventional
Purchase Details
Closed on
May 31, 2007
Sold by
Zorn Laura Ellen and Zorn Mary Holland
Bought by
Fraga Huga A
Create a Home Valuation Report for This Property
The Home Valuation Report is an in-depth analysis detailing your home's value as well as a comparison with similar homes in the area
Purchase History
| Date | Buyer | Sale Price | Title Company |
|---|---|---|---|
| Tinyhead Llc | -- | None Listed On Document | |
| Fraga David | -- | None Listed On Document | |
| Graga David | -- | Homeland Title | |
| Fraga Huga A | -- | None Available | |
| Fraga Huga A | -- | None Available |
Source: Public Records
Mortgage History
| Date | Status | Borrower | Loan Amount |
|---|---|---|---|
| Open | Tinyhead Llc | $116,500 | |
| Previous Owner | Graga David | $130,000 |
Source: Public Records
Tax History
| Year | Tax Paid | Tax Assessment Tax Assessment Total Assessment is a certain percentage of the fair market value that is determined by local assessors to be the total taxable value of land and additions on the property. | Land | Improvement |
|---|---|---|---|---|
| 2025 | $2,992 | $175,855 | $35,237 | $140,618 |
| 2024 | $2,751 | $161,680 | $17,100 | $144,580 |
| 2023 | $3,349 | $192,142 | $17,100 | $175,042 |
| 2022 | $3,405 | $173,819 | $15,618 | $158,201 |
| 2021 | $2,241 | $106,824 | $15,618 | $91,206 |
| 2020 | $2,257 | $105,492 | $15,618 | $89,874 |
| 2019 | $2,311 | $105,684 | $15,618 | $90,066 |
| 2018 | $2,262 | $103,983 | $11,400 | $92,583 |
| 2017 | $2,220 | $103,983 | $11,400 | $92,583 |
| 2016 | $1,990 | $93,217 | $11,400 | $81,817 |
| 2015 | $1,830 | $88,696 | $11,400 | $77,296 |
| 2014 | $1,830 | $86,112 | $11,400 | $74,712 |
Source: Public Records
Map
Nearby Homes
- 2904 New Copeland Rd
- 611 E Watkins St
- 2916 Crestview Ave
- 3126 Colgate Ave
- 317 Amberwood Cir
- 414 Wilma St
- 1018 Pollard Dr
- 921 E Barbara St
- 1101 Clyde Dr
- 3432 New Copeland Rd
- 901 Rhodes Dr
- 3140 Bracken Dr
- 3828 Cr 219
- 1126 Pollard Dr
- 3528 New Copeland Rd
- 1113 E Amherst Dr
- 2521 Pounds Ave
- 3313 S Cameron Ave
- 2526 Pounds Ave
- 309 Glenhaven Dr
- 600 Clyde Dr
- 614 Clyde Dr
- 0 S Vine Unit 29342199
- 2930 New Copeland Rd
- 620 Clyde Dr
- 2924 New Copeland Rd
- 3003 3003 Copeland Rd
- 626 Clyde Dr
- 626 626 Clyde
- 3013 3013 New Copeland
- 3003 New Copeland Rd
- 3009 New Copeland Rd
- 2937 New Copeland Rd
- 3013 New Copeland Rd
- 2931 New Copeland Rd
- 2927 2927 Copeland Rd
- 632 Clyde Dr
- 522 Stanford St
- 2931 Pollard Dr
- 2912 New Copeland Rd
Your Personal Tour Guide
Ask me questions while you tour the home.