608 E 10th St Vinton, IA 52349
Estimated Value: $96,674 - $146,000
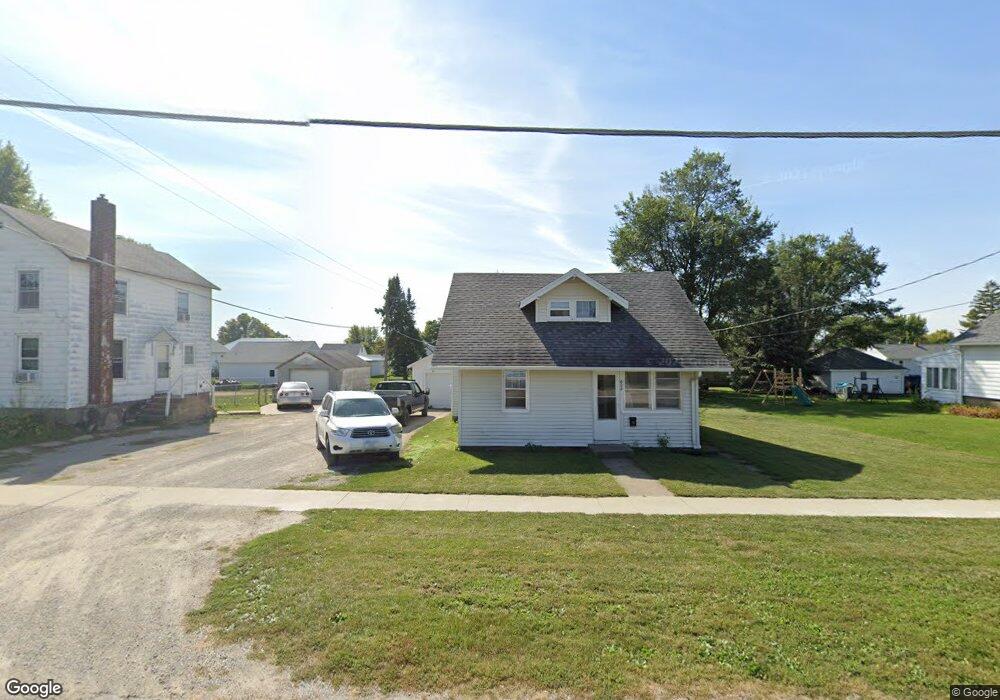
About This Home
This home is located at 608 E 10th St, Vinton, IA 52349 and is currently estimated at $121,919, approximately $149 per square foot. 608 E 10th St is a home with nearby schools including Tilford Elementary School, Vinton-Shellsburg Middle School, and Vinton-Shellsburg High School.
Ownership History
We collect this data history from publicly available records. To have your information removed, we recommend requesting removal directly through your county’s website.
Purchase Details
Home Financials for this Owner
Home Financials are based on the most recent Mortgage that was taken out on this home.Home Values in the Area
Average Home Value in this Area
Purchase History
We collect this data history from publicly available records. To have your information removed, we recommend requesting removal directly through your county’s website.
| Date | Buyer | Sale Price | Title Company |
|---|---|---|---|
| $35,000 | None Available |
Mortgage History
We collect this data history from publicly available records. To have your information removed, we recommend requesting removal directly through your county’s website.
| Date | Status | Borrower | Loan Amount |
|---|---|---|---|
| Open | $35,000 |
Tax History
We collect this data history from publicly available records. To have your information removed, we recommend requesting removal directly through your county’s website.
| Year | Tax Paid | Tax Assessment Tax Assessment Total Assessment is a certain percentage of the fair market value that is determined by local assessors to be the total taxable value of land and additions on the property. | Land | Improvement |
|---|---|---|---|---|
| 2025 | $1,396 | $80,400 | $16,500 | $63,900 |
| 2024 | $1,396 | $74,500 | $16,500 | $58,000 |
| 2023 | $1,304 | $74,500 | $16,500 | $58,000 |
| 2022 | $1,338 | $60,600 | $13,200 | $47,400 |
| 2021 | $1,338 | $60,600 | $13,200 | $47,400 |
| 2020 | $1,020 | $47,100 | $10,600 | $36,500 |
| 2019 | $1,066 | $47,100 | $10,600 | $36,500 |
| 2018 | $1,034 | $48,600 | $9,800 | $38,800 |
| 2017 | $998 | $48,600 | $9,800 | $38,800 |
| 2016 | $982 | $45,500 | $9,200 | $36,300 |
| 2015 | $982 | $45,500 | $9,200 | $36,300 |
| 2014 | $1,060 | $49,000 | $0 | $0 |
Map
- 1002 S 8th Ave
- 0 Lot 32 Mary Ingalls Subdivision Unit 2602214
- 212 E 9th St
- 1114 2nd Ave
- 903 E 12th St
- 304 Viking Dr
- 206 E 13th St
- 516 E 4th St
- 614 E 4th St
- 1105 E 5th St
- 1122 E 3rd St
- 306 14th Ave
- 101 Country Club Dr
- 703 F Ave
- 601 W 19th St
- 1503 G Ave
- 1001 W 13th St
- 913 W 13th St
- 1005 W 13th St
- 1206 J Ave
Ask me questions while you tour the home.