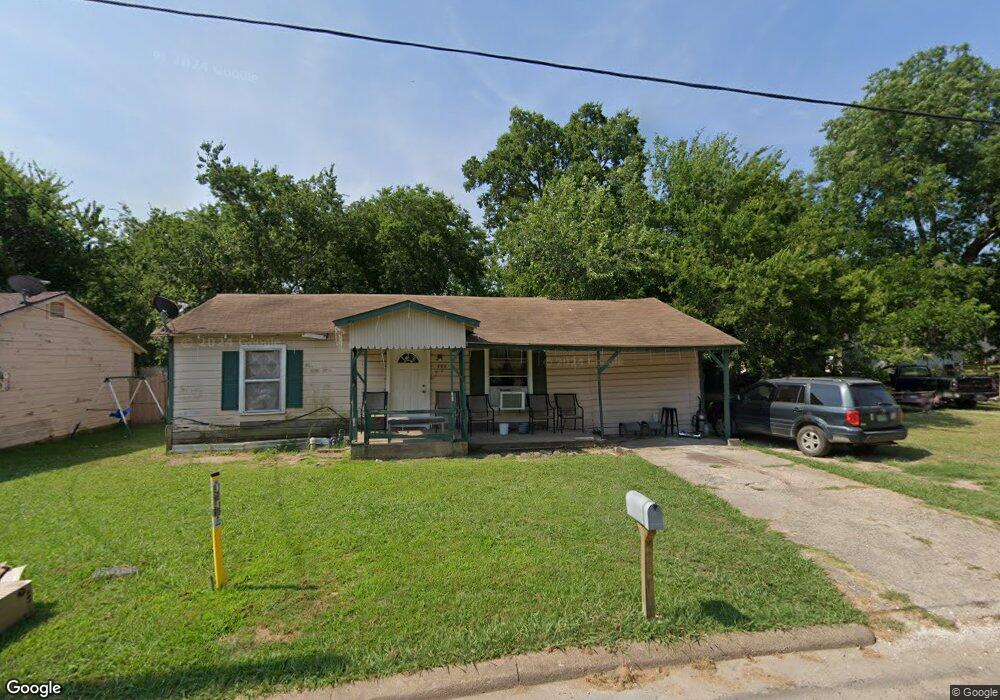
608 E 11th St Bonham, TX 75418
Estimated Value: $78,000 - $143,000
2
Beds
1
Bath
768
Sq Ft
$148/Sq Ft
Est. Value
About This Home
This home is located at 608 E 11th St, Bonham, TX 75418 and is currently estimated at $113,326, approximately $147 per square foot. 608 E 11th St is a home located in Fannin County with nearby schools including Evans Elementary School, Finley-Oates Elementary School, and LH Rather Jr High School.
Ownership History
Date
Name
Owned For
Owner Type
Purchase Details
Closed on
Sep 8, 2016
Sold by
Herrington David
Bought by
Sanchez Suyapa Argentina Sandoval
Current Estimated Value
Home Financials for this Owner
Home Financials are based on the most recent Mortgage that was taken out on this home.
Original Mortgage
$10,000
Outstanding Balance
$7,957
Interest Rate
3.48%
Mortgage Type
Land Contract Argmt. Of Sale
Estimated Equity
$105,369
Purchase Details
Closed on
Jan 27, 2014
Sold by
Nelms Billy Joe
Bought by
Montoya Eidy and Chaves Rodrigo Salomon Varela
Home Financials for this Owner
Home Financials are based on the most recent Mortgage that was taken out on this home.
Original Mortgage
$24,000
Interest Rate
4.49%
Mortgage Type
Purchase Money Mortgage
Create a Home Valuation Report for This Property
The Home Valuation Report is an in-depth analysis detailing your home's value as well as a comparison with similar homes in the area
Purchase History
| Date | Buyer | Sale Price | Title Company |
|---|---|---|---|
| Sanchez Suyapa Argentina Sandoval | $20,000 | None Available | |
| Montoya Eidy | $28,000 | None Available |
Source: Public Records
Mortgage History
| Date | Status | Borrower | Loan Amount |
|---|---|---|---|
| Open | Sanchez Suyapa Argentina Sandoval | $10,000 | |
| Closed | Montoya Eidy | $24,000 |
Source: Public Records
Tax History
| Year | Tax Paid | Tax Assessment Tax Assessment Total Assessment is a certain percentage of the fair market value that is determined by local assessors to be the total taxable value of land and additions on the property. | Land | Improvement |
|---|---|---|---|---|
| 2025 | $1,445 | $74,500 | $41,510 | $32,990 |
| 2024 | $1,451 | $74,800 | $40,330 | $34,470 |
| 2023 | $1,340 | $67,970 | $32,590 | $35,380 |
| 2022 | $1,248 | $56,760 | $23,240 | $33,520 |
| 2021 | $1,119 | $44,290 | $11,540 | $32,750 |
| 2020 | $1,022 | $39,970 | $8,590 | $31,380 |
| 2019 | $1,028 | $38,700 | $8,420 | $30,280 |
| 2018 | $998 | $37,590 | $8,340 | $29,250 |
| 2017 | $751 | $29,380 | $4,130 | $25,250 |
| 2016 | $667 | $26,100 | $4,130 | $21,970 |
| 2015 | -- | $14,660 | $3,960 | $10,700 |
| 2014 | -- | $14,890 | $3,220 | $11,670 |
Source: Public Records
Map
Nearby Homes
Your Personal Tour Guide
Ask me questions while you tour the home.