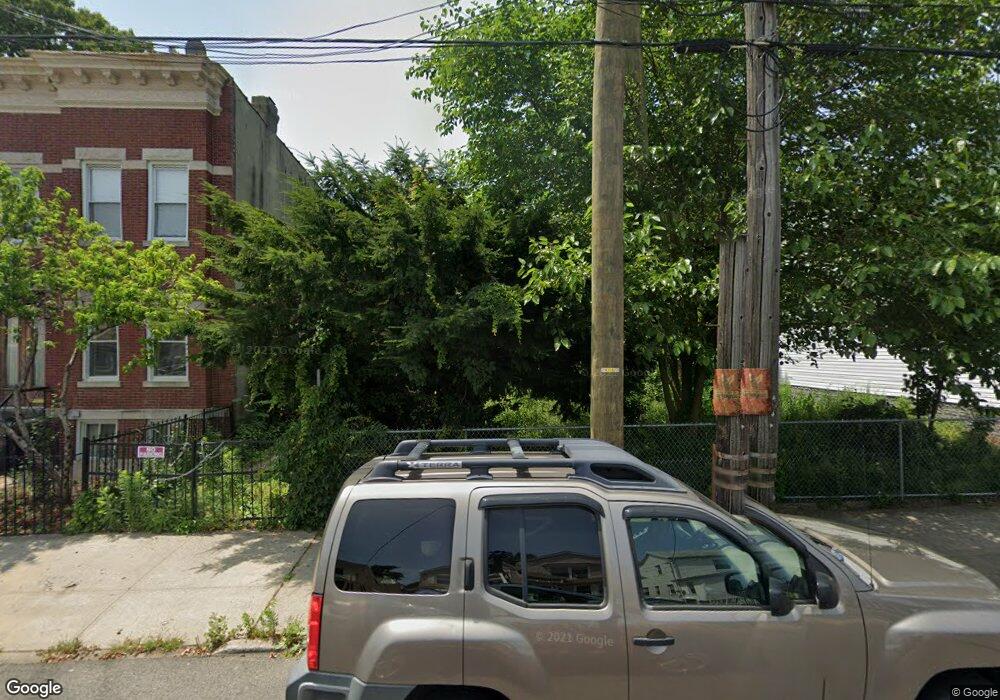
608 E 43rd St Unit 2 Brooklyn, NY 11203
East Flatbush NeighborhoodEstimated Value: $960,000 - $1,073,000
3
Beds
1
Bath
900
Sq Ft
$1,132/Sq Ft
Est. Value
About This Home
This home is located at 608 E 43rd St Unit 2, Brooklyn, NY 11203 and is currently estimated at $1,019,000, approximately $1,132 per square foot. 608 E 43rd St Unit 2 is a home located in Kings County with nearby schools including P.S. 109, Andries Hudde School, and Ebenezer Preparatory School.
Ownership History
Date
Name
Owned For
Owner Type
Purchase Details
Closed on
Dec 30, 2021
Sold by
Amsm Development Llc
Bought by
Cohen David
Current Estimated Value
Home Financials for this Owner
Home Financials are based on the most recent Mortgage that was taken out on this home.
Original Mortgage
$780,000
Outstanding Balance
$718,867
Interest Rate
3.11%
Mortgage Type
Purchase Money Mortgage
Estimated Equity
$300,133
Create a Home Valuation Report for This Property
The Home Valuation Report is an in-depth analysis detailing your home's value as well as a comparison with similar homes in the area
Home Values in the Area
Average Home Value in this Area
Purchase History
| Date | Buyer | Sale Price | Title Company |
|---|---|---|---|
| Cohen David | -- | -- |
Source: Public Records
Mortgage History
| Date | Status | Borrower | Loan Amount |
|---|---|---|---|
| Open | Cohen David | $780,000 |
Source: Public Records
Tax History
| Year | Tax Paid | Tax Assessment Tax Assessment Total Assessment is a certain percentage of the fair market value that is determined by local assessors to be the total taxable value of land and additions on the property. | Land | Improvement |
|---|---|---|---|---|
| 2025 | $10,034 | $77,760 | $9,480 | $68,280 |
| 2024 | $10,034 | $61,440 | $9,480 | $51,960 |
| 2023 | $9,571 | $54,300 | $9,480 | $44,820 |
| 2022 | $8,876 | $44,460 | $9,480 | $34,980 |
| 2021 | $2,119 | $11,820 | $11,820 | $0 |
| 2019 | $1,323 | $8,880 | $8,880 | $0 |
| 2018 | $1,217 | $5,971 | $5,971 | $0 |
| 2017 | $1,217 | $5,971 | $5,971 | $0 |
| 2016 | $1,180 | $5,904 | $5,904 | $0 |
| 2015 | $679 | $5,572 | $5,572 | $0 |
| 2014 | $679 | $5,272 | $5,272 | $0 |
Source: Public Records
Map
Nearby Homes
Your Personal Tour Guide
Ask me questions while you tour the home.