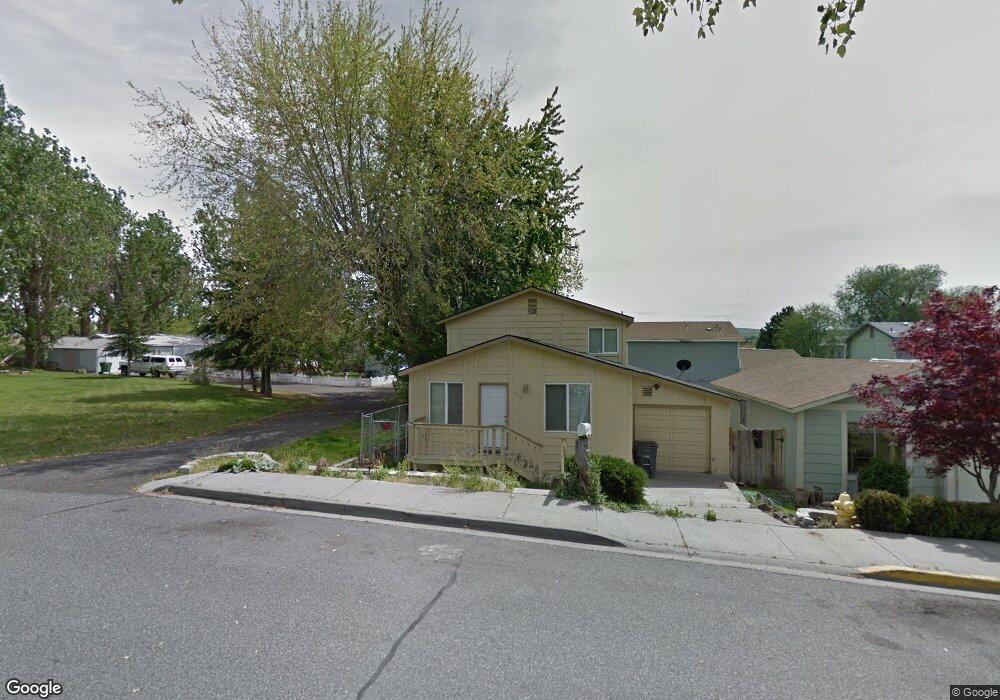
608 E 8th Ave Unit Short Sale-Please re Kennewick, WA 99336
Estimated Value: $295,000 - $315,000
3
Beds
2
Baths
1,416
Sq Ft
$216/Sq Ft
Est. Value
About This Home
This home is located at 608 E 8th Ave Unit Short Sale-Please re, Kennewick, WA 99336 and is currently estimated at $305,949, approximately $216 per square foot. 608 E 8th Ave Unit Short Sale-Please re is a home located in Benton County with nearby schools including Eastgate Elementary School, Park Middle School, and Kennewick High School.
Ownership History
Date
Name
Owned For
Owner Type
Purchase Details
Closed on
Nov 4, 2016
Sold by
Douglas L Sharp Holdings Llc
Bought by
Schrmerhorn Kelly
Current Estimated Value
Home Financials for this Owner
Home Financials are based on the most recent Mortgage that was taken out on this home.
Original Mortgage
$4,713
Outstanding Balance
$3,791
Interest Rate
3.48%
Mortgage Type
Stand Alone Second
Estimated Equity
$302,158
Purchase Details
Closed on
Jun 30, 2016
Sold by
Dufresne Jeff A
Bought by
Douglas L Sharp Holdings Llc
Purchase Details
Closed on
Oct 27, 2006
Sold by
Dufresne Jennifer
Bought by
Dufresne Jeff A
Home Financials for this Owner
Home Financials are based on the most recent Mortgage that was taken out on this home.
Original Mortgage
$103,550
Interest Rate
8.87%
Mortgage Type
Purchase Money Mortgage
Create a Home Valuation Report for This Property
The Home Valuation Report is an in-depth analysis detailing your home's value as well as a comparison with similar homes in the area
Home Values in the Area
Average Home Value in this Area
Purchase History
| Date | Buyer | Sale Price | Title Company |
|---|---|---|---|
| Schrmerhorn Kelly | $120,000 | Cascade Title Company | |
| Douglas L Sharp Holdings Llc | $63,000 | Stewart Title Company | |
| Dufresne Jeff A | -- | Frontier Title & Esc | |
| Dufresne Jeff | $109,000 | Frontier Title & Esc |
Source: Public Records
Mortgage History
| Date | Status | Borrower | Loan Amount |
|---|---|---|---|
| Open | Schrmerhorn Kelly | $4,713 | |
| Previous Owner | Dufresne Jeff A | $103,550 |
Source: Public Records
Tax History Compared to Growth
Tax History
| Year | Tax Paid | Tax Assessment Tax Assessment Total Assessment is a certain percentage of the fair market value that is determined by local assessors to be the total taxable value of land and additions on the property. | Land | Improvement |
|---|---|---|---|---|
| 2024 | $2,218 | $246,950 | $52,500 | $194,450 |
| 2023 | $2,218 | $239,750 | $52,500 | $187,250 |
| 2022 | $1,683 | $196,540 | $52,500 | $144,040 |
| 2021 | $1,557 | $144,310 | $34,000 | $110,310 |
| 2020 | $1,559 | $129,010 | $18,700 | $110,310 |
| 2019 | $1,441 | $125,330 | $18,700 | $106,630 |
| 2018 | $1,378 | $117,980 | $18,700 | $99,280 |
| 2017 | $1,289 | $92,240 | $18,700 | $73,540 |
| 2016 | $1,287 | $92,240 | $18,700 | $73,540 |
| 2015 | $1,281 | $91,520 | $22,000 | $69,520 |
| 2014 | -- | $91,520 | $22,000 | $69,520 |
| 2013 | -- | $91,520 | $22,000 | $69,520 |
Source: Public Records
Map
Nearby Homes
- 602 E 8th Ave
- 415 E 8th Ave
- 811 E 4th Ave
- 408 S Gum St
- 818 S Juniper St
- 721 E 15th Ave
- 451 E 15th Place
- 1111 E 6th Ave
- 2731 S Alder St
- 2707 S Alder St
- 309 E 2nd Ave
- 26 E 3rd Ave
- 205 E 15th Ave
- 1401 E 6th Ave
- 305 W 10th Ave
- 114 S Alder St
- 325 W 11th Ave
- 1407 S Cascade St
- 626 S Everett St
- 1631 S Dayton Place
- 608 E 8th Ave Unit Short Sale
- 608 E 8th Ave
- 602 E 8th Ave Unit Calling all Investor
- 602 E 8th Ave Unit Calling all First Ti
- 543 E 8th Place
- 536 E 8th Ave
- 537 E 8th Place
- 530 E 8th Ave
- 531 E 8th Place
- 801 E 8th Place
- 509 E 8th Ave
- 813 S Fir St
- 524 E 8th Ave
- 624 E 8th Ave
- 819 S Fir St
- 814 S Fir St
- 733 S Fir St
- 519 E 8th Place
- 615 E 9th Place
- 825 S Fir St