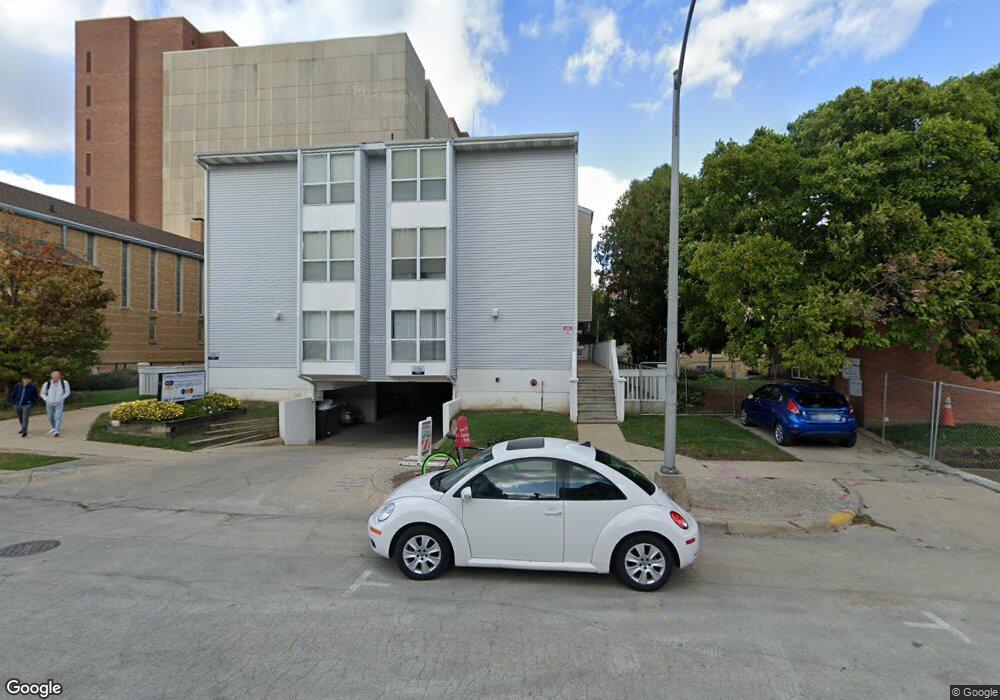
608 E Chalmers St Champaign, IL 61820
Estimated Value: $1,897,899
4
Beds
--
Bath
1,317
Sq Ft
$1,441/Sq Ft
Est. Value
About This Home
This home is located at 608 E Chalmers St, Champaign, IL 61820 and is currently estimated at $1,897,899, approximately $1,441 per square foot. 608 E Chalmers St is a home located in Champaign County with nearby schools including Central High School and Kingswood School.
Ownership History
Date
Name
Owned For
Owner Type
Purchase Details
Closed on
Dec 2, 2025
Sold by
Flc 608 E Chalmers Ii Llc
Bought by
Lutheran Student Foundation Of The University and St Andrews Church/Lutheran Campus Center
Current Estimated Value
Purchase Details
Closed on
Jan 16, 2024
Sold by
Flc 608 E Chalmers Llc
Bought by
Flc 608 E Chalmers Ii Llc
Purchase Details
Closed on
Dec 8, 2021
Sold by
Milonga Llc
Bought by
Flc 105 S Wright Llc
Home Financials for this Owner
Home Financials are based on the most recent Mortgage that was taken out on this home.
Original Mortgage
$25,535,348
Interest Rate
3.14%
Mortgage Type
Purchase Money Mortgage
Purchase Details
Closed on
Jul 11, 2018
Sold by
Scherer Kathleen Ann
Bought by
Milonga Llc
Home Financials for this Owner
Home Financials are based on the most recent Mortgage that was taken out on this home.
Original Mortgage
$2,500,000
Interest Rate
4.6%
Mortgage Type
Commercial
Create a Home Valuation Report for This Property
The Home Valuation Report is an in-depth analysis detailing your home's value as well as a comparison with similar homes in the area
Purchase History
| Date | Buyer | Sale Price | Title Company |
|---|---|---|---|
| Lutheran Student Foundation Of The University | -- | None Listed On Document | |
| Flc 608 E Chalmers Ii Llc | $1,555,000 | None Listed On Document | |
| Flc 105 S Wright Llc | $12,536,500 | Attorney | |
| Milonga Llc | $1,902,500 | Attorney | |
| Molonga Llc | -- | Attorney | |
| Scherer Kathleen Ann | -- | Attorney |
Source: Public Records
Mortgage History
| Date | Status | Borrower | Loan Amount |
|---|---|---|---|
| Previous Owner | Flc 105 S Wright Llc | $25,535,348 | |
| Previous Owner | Molonga Llc | $2,500,000 |
Source: Public Records
Property History
| Date | Event | Price | List to Sale | Price per Sq Ft |
|---|---|---|---|---|
| 10/04/2025 10/04/25 | Off Market | $1,170 | -- | -- |
| 09/26/2025 09/26/25 | Price Changed | $1,170 | +20.6% | $3 / Sq Ft |
| 09/24/2025 09/24/25 | Price Changed | $970 | -14.4% | $2 / Sq Ft |
| 08/22/2025 08/22/25 | For Rent | $1,133 | +19.4% | -- |
| 07/20/2025 07/20/25 | Price Changed | $949 | -2.2% | $2 / Sq Ft |
| 06/20/2025 06/20/25 | Price Changed | $970 | +2.1% | $2 / Sq Ft |
| 06/05/2025 06/05/25 | Price Changed | $950 | -3.3% | $2 / Sq Ft |
| 06/04/2025 06/04/25 | Price Changed | $982 | +3.3% | $2 / Sq Ft |
| 04/24/2025 04/24/25 | Price Changed | $951 | -7.7% | $2 / Sq Ft |
| 04/17/2025 04/17/25 | Price Changed | $1,030 | +15.7% | $2 / Sq Ft |
| 04/16/2025 04/16/25 | Price Changed | $890 | -6.3% | $2 / Sq Ft |
| 03/27/2025 03/27/25 | Price Changed | $950 | -16.3% | $2 / Sq Ft |
| 02/01/2025 02/01/25 | Price Changed | $1,135 | -- | $3 / Sq Ft |
Tax History
| Year | Tax Paid | Tax Assessment Tax Assessment Total Assessment is a certain percentage of the fair market value that is determined by local assessors to be the total taxable value of land and additions on the property. | Land | Improvement |
|---|---|---|---|---|
| 2024 | $68,821 | $837,950 | $221,770 | $616,180 |
| 2023 | $68,821 | $763,160 | $201,980 | $561,180 |
| 2022 | $64,740 | $704,020 | $186,330 | $517,690 |
| 2021 | $59,610 | $651,150 | $172,340 | $478,810 |
| 2020 | $56,858 | $620,140 | $164,130 | $456,010 |
| 2019 | $55,030 | $607,380 | $160,750 | $446,630 |
| 2018 | $53,795 | $597,820 | $158,220 | $439,600 |
| 2017 | $54,019 | $597,820 | $158,220 | $439,600 |
| 2016 | $48,433 | $585,530 | $154,970 | $430,560 |
| 2015 | $41,821 | $575,180 | $152,230 | $422,950 |
| 2014 | $41,464 | $492,890 | $69,940 | $422,950 |
| 2013 | $41,091 | $492,890 | $69,940 | $422,950 |
Source: Public Records
Map
Nearby Homes
- 801 W Oregon St
- 709 W Nevada St
- 805 W Indiana Ave
- 804 W Michigan Ave
- 704 W Illinois St
- 1207 S Busey Ave
- 702 W Iowa St
- 404 E Park St
- 812 W Delaware Ave
- 504 E Church St
- 603 W Green St
- 707 W Main St
- 1208 W Church St
- 401 S Neil St
- 1001 S Douglas Ave
- 1109 S Douglas Ave
- 1204 W Hill St
- 407 W High St
- 722 S Prairie St
- 1506 S Orchard St
- 1006 S Wright St
- 608 E Daniel St
- 602 E Daniel St Unit 4
- 602 E Daniel St Unit 3
- 602 E Daniel St Unit 2
- 808 S 6th St Unit 1
- 1005 S 6th St
- 715 S 6th St
- 409 E Chalmers St
- 512 E John St Unit One and a half
- 512 E John St
- 708 S 6th St
- 708 S 6th St
- 502 E John St
- 401 E Chalmers St
- 1008 S 4th St
- 617 E Green St Unit 1
- 617 E Green St
- 611 E Green St Unit A
- 1008 Fourth
Your Personal Tour Guide
Ask me questions while you tour the home.