Estimated Value: $177,000 - $178,909
--
Bed
2
Baths
1,258
Sq Ft
$141/Sq Ft
Est. Value
About This Home
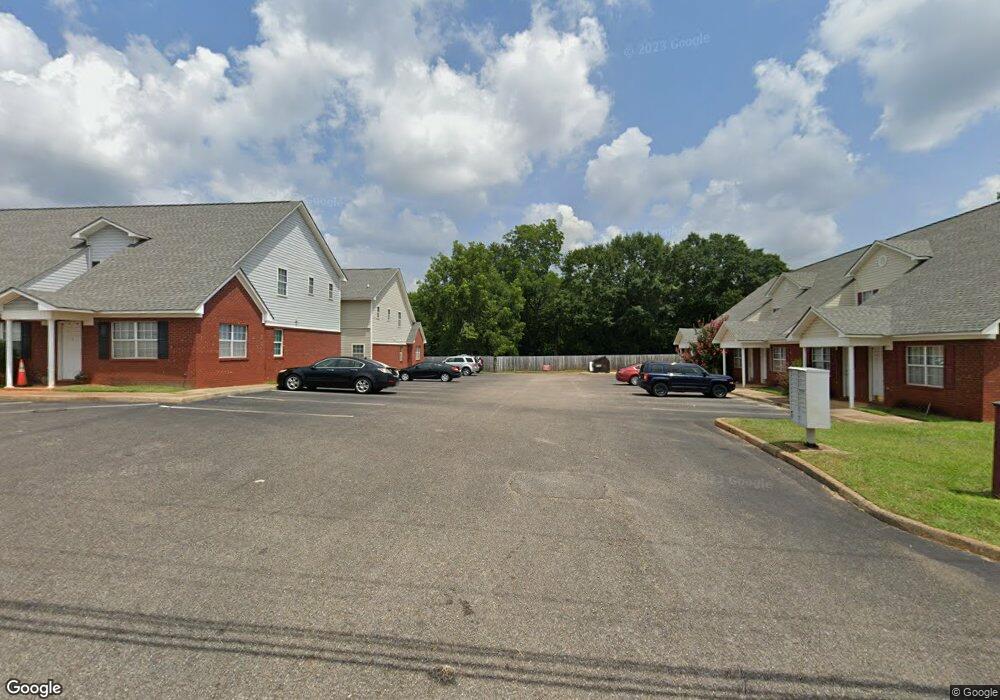
This home is located at 608 E Elm St, Troy, AL 36081 and is currently estimated at $177,955, approximately $141 per square foot. 608 E Elm St is a home located in Pike County with nearby schools including Troy Elementary School, Charles Henderson Middle School, and Charles Henderson High School.
Ownership History
Date
Name
Owned For
Owner Type
Purchase Details
Closed on
Feb 23, 2023
Sold by
Cole Brooke Properties Llc
Bought by
Garmon Properties Llc
Current Estimated Value
Home Financials for this Owner
Home Financials are based on the most recent Mortgage that was taken out on this home.
Original Mortgage
$265,000
Outstanding Balance
$256,685
Interest Rate
6.33%
Mortgage Type
New Conventional
Estimated Equity
-$78,730
Purchase Details
Closed on
Aug 5, 2020
Sold by
Hu Jiayu
Bought by
Cole Brooke Properties Llc
Home Financials for this Owner
Home Financials are based on the most recent Mortgage that was taken out on this home.
Original Mortgage
$103,700
Interest Rate
3%
Mortgage Type
Commercial
Purchase Details
Closed on
Jul 31, 2018
Sold by
H2b Llc
Bought by
Hu Jiayu
Purchase Details
Closed on
Jan 3, 2006
Sold by
Fleming Harold and Fleming Loretta S
Bought by
Johns Tara and Johns Billy Joe
Create a Home Valuation Report for This Property
The Home Valuation Report is an in-depth analysis detailing your home's value as well as a comparison with similar homes in the area
Home Values in the Area
Average Home Value in this Area
Purchase History
| Date | Buyer | Sale Price | Title Company |
|---|---|---|---|
| Garmon Properties Llc | $295,000 | -- | |
| Cole Brooke Properties Llc | $124,000 | None Available | |
| Hu Jiayu | $117,000 | None Available | |
| Johns Tara | -- | -- |
Source: Public Records
Mortgage History
| Date | Status | Borrower | Loan Amount |
|---|---|---|---|
| Open | Garmon Properties Llc | $265,000 | |
| Previous Owner | Cole Brooke Properties Llc | $103,700 |
Source: Public Records
Tax History Compared to Growth
Tax History
| Year | Tax Paid | Tax Assessment Tax Assessment Total Assessment is a certain percentage of the fair market value that is determined by local assessors to be the total taxable value of land and additions on the property. | Land | Improvement |
|---|---|---|---|---|
| 2024 | $1,014 | $27,440 | $6,000 | $21,440 |
| 2023 | $1,014 | $27,520 | $0 | $0 |
| 2022 | $854 | $23,100 | $0 | $0 |
| 2021 | $861 | $6,000 | $6,000 | $0 |
| 2020 | $435 | $3,000 | $3,000 | $0 |
| 2019 | $416 | $3,700 | $3,700 | $0 |
| 2018 | $919 | $24,860 | $7,400 | $17,460 |
| 2017 | $919 | $24,860 | $7,400 | $17,460 |
| 2016 | $919 | $24,860 | $7,400 | $17,460 |
| 2015 | $955 | $129,180 | $0 | $0 |
| 2014 | $891 | $120,470 | $0 | $0 |
| 2013 | $891 | $120,460 | $0 | $0 |
Source: Public Records
Map
Nearby Homes
- 608 E Elm St
- 112 Turnipseed Ave
- 536 E Walnut St
- 110 Chapman St
- 107 Martin Luther King Dr
- 638 E Madison St
- 119 Gamble St
- 0 Griffin St
- 516to617 Folmar & Madison Streets
- 316 S Brundidge St
- 84 Walters St
- 0 Martin Luther King Dr
- 200 Forrest Cir
- 331 Love St
- 200 Banks St
- 609 Martin Luther King Dr
- 306 Mulberry St
- 0 University Ave Unit 25726
- 719 N Three Notch St
- 105 Minchner St