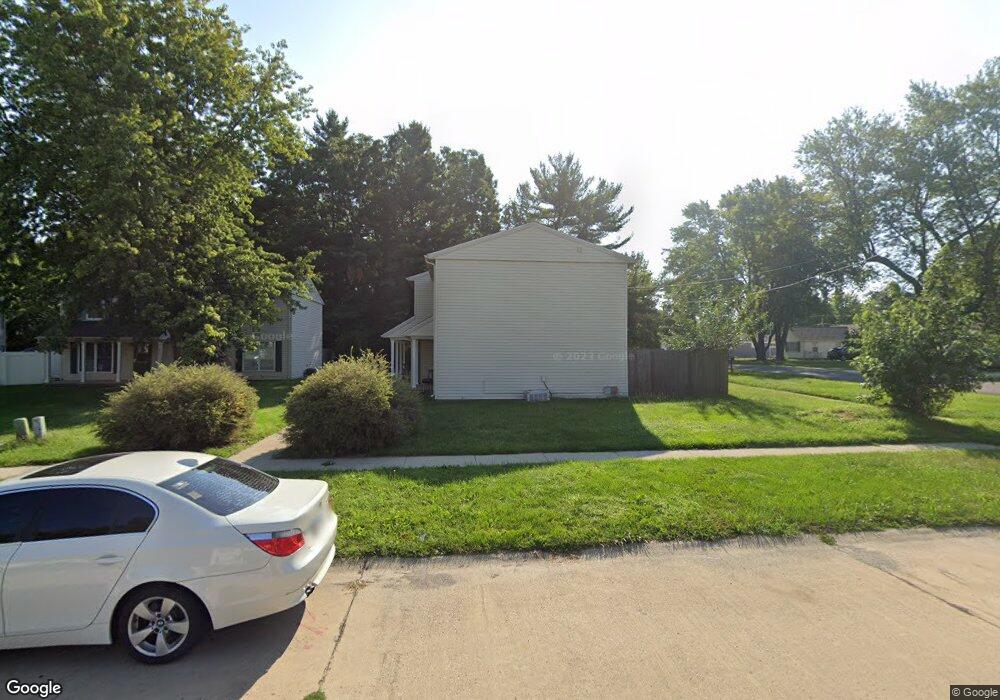
608 English Creek Ct Unit A Champaign, IL 61821
Estimated Value: $94,000 - $138,000
2
Beds
2
Baths
1,000
Sq Ft
$113/Sq Ft
Est. Value
About This Home
This home is located at 608 English Creek Ct Unit A, Champaign, IL 61821 and is currently estimated at $113,212, approximately $113 per square foot. 608 English Creek Ct Unit A is a home located in Champaign County with nearby schools including Centennial High School, St. John Lutheran School, and Swann Special Care Center-Elem/Secondary School.
Ownership History
Date
Name
Owned For
Owner Type
Purchase Details
Closed on
Jun 14, 2023
Sold by
Rcf 2 Acquisition Trust
Bought by
Dominguez Gonzalez Jorge and Enriq Mares Luz
Current Estimated Value
Purchase Details
Closed on
Jan 13, 2023
Sold by
Malloch Erin
Bought by
Rcf 2 Acquisition Trust
Purchase Details
Closed on
Jun 30, 2005
Sold by
English Creek Llc
Bought by
Malloch Erin
Home Financials for this Owner
Home Financials are based on the most recent Mortgage that was taken out on this home.
Original Mortgage
$75,050
Interest Rate
5.86%
Mortgage Type
Fannie Mae Freddie Mac
Purchase Details
Closed on
Feb 23, 2005
Sold by
Premier Investors Ltd
Bought by
English Creek Llc
Home Financials for this Owner
Home Financials are based on the most recent Mortgage that was taken out on this home.
Original Mortgage
$1,500,000
Interest Rate
5.5%
Mortgage Type
Purchase Money Mortgage
Create a Home Valuation Report for This Property
The Home Valuation Report is an in-depth analysis detailing your home's value as well as a comparison with similar homes in the area
Home Values in the Area
Average Home Value in this Area
Purchase History
| Date | Buyer | Sale Price | Title Company |
|---|---|---|---|
| Dominguez Gonzalez Jorge | $51,000 | None Listed On Document | |
| Rcf 2 Acquisition Trust | -- | -- | |
| Malloch Erin | $79,000 | -- | |
| English Creek Llc | $1,565,000 | -- |
Source: Public Records
Mortgage History
| Date | Status | Borrower | Loan Amount |
|---|---|---|---|
| Previous Owner | Malloch Erin | $75,050 | |
| Previous Owner | English Creek Llc | $1,500,000 |
Source: Public Records
Tax History Compared to Growth
Tax History
| Year | Tax Paid | Tax Assessment Tax Assessment Total Assessment is a certain percentage of the fair market value that is determined by local assessors to be the total taxable value of land and additions on the property. | Land | Improvement |
|---|---|---|---|---|
| 2024 | $2,247 | $27,370 | $2,990 | $24,380 |
| 2023 | $2,247 | $24,920 | $2,720 | $22,200 |
| 2022 | $2,114 | $22,990 | $2,510 | $20,480 |
| 2021 | $2,063 | $22,540 | $2,460 | $20,080 |
| 2020 | $2,067 | $22,540 | $2,460 | $20,080 |
| 2019 | $2,001 | $22,080 | $2,410 | $19,670 |
| 2018 | $1,955 | $21,730 | $2,370 | $19,360 |
| 2017 | $1,421 | $21,730 | $2,370 | $19,360 |
| 2016 | $1,264 | $21,280 | $2,320 | $18,960 |
| 2015 | $1,264 | $20,900 | $2,280 | $18,620 |
| 2014 | $1,253 | $20,900 | $2,280 | $18,620 |
| 2013 | $1,242 | $20,900 | $2,280 | $18,620 |
Source: Public Records
Map
Nearby Homes
- 2908 W John St Unit B
- 610 S Duncan Rd Unit A
- 901 Dogwood Dr
- 806 Scottsdale Dr
- 3311 Brentwood Dr
- 2501 Sheridan Dr
- 3334 Ridgewood Dr
- 2808 Carrelton Dr
- 1309 Maplepark Dr
- 1012 Waters Edge Rd
- 1402 Scottsdale Dr
- 3804 Balmoral Dr
- 1508 Centennial Dr
- 3761 Thornhill Cir Unit 3761
- 2612 W Kirby Ave
- 1407 Kenwood Rd
- 501 Creve Coeur Dr
- 409 Irvine Rd
- 2605 Trafalgar Square
- 3907 Aberdeen Dr
- 608 English Creek Ct Unit B
- 608 English Creek Ct
- 608B English Creek Ct Unit 1
- 610A English Creek Ct Unit 1
- 606B English Creek Ct Unit B
- 606 English Creek Ct Unit B
- 606 English Creek Ct Unit A
- 606A English Creek Ct Unit 1
- 610B English Creek Ct Unit 1
- 610 English Creek Ct Unit A
- 610 English Creek Ct
- 604B English Creek Ct Unit B
- 604 English Creek Ct Unit B
- 604 English Creek Ct Unit A
- 604A English Creek Ct Unit 1
- 2904 W John St Unit B
- 2904 W John St
- 603 English Creek Ct Unit B
- 603 English Creek Ct Unit A
- 603A English Creek Ct Unit 1