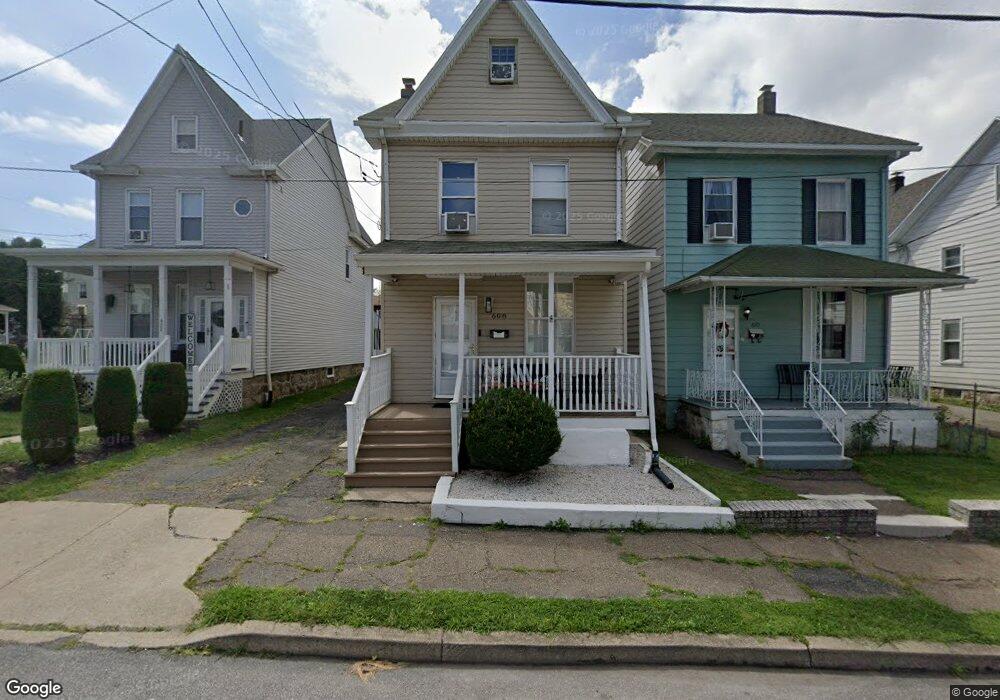
608 Grant St Hazleton, PA 18201
Estimated Value: $190,000 - $275,000
3
Beds
2
Baths
1,408
Sq Ft
$162/Sq Ft
Est. Value
About This Home
This home is located at 608 Grant St, Hazleton, PA 18201 and is currently estimated at $228,744, approximately $162 per square foot. 608 Grant St is a home located in Luzerne County with nearby schools including Hazleton Area High School, Immanuel Christian School, and Holy Family Academy.
Ownership History
Date
Name
Owned For
Owner Type
Purchase Details
Closed on
Apr 25, 2022
Sold by
Luna Minaya Maria C
Bought by
Padilla Alvaro L Almonte
Current Estimated Value
Purchase Details
Closed on
Aug 16, 2019
Sold by
Farkus Angela Ann
Bought by
Minaya Maria C Luna
Home Financials for this Owner
Home Financials are based on the most recent Mortgage that was taken out on this home.
Original Mortgage
$128,627
Interest Rate
3.7%
Mortgage Type
FHA
Purchase Details
Closed on
Jan 24, 2013
Sold by
Fannie Mae
Bought by
Farkus Angela Ann
Home Financials for this Owner
Home Financials are based on the most recent Mortgage that was taken out on this home.
Original Mortgage
$54,003
Interest Rate
2.95%
Mortgage Type
FHA
Purchase Details
Closed on
May 14, 2012
Sold by
Sell David J and Wells Fargo Bank Na
Bought by
Federal National Mortgage Association
Purchase Details
Closed on
Mar 21, 2005
Sold by
Sell David J
Bought by
Sell David John
Create a Home Valuation Report for This Property
The Home Valuation Report is an in-depth analysis detailing your home's value as well as a comparison with similar homes in the area
Home Values in the Area
Average Home Value in this Area
Purchase History
| Date | Buyer | Sale Price | Title Company |
|---|---|---|---|
| Padilla Alvaro L Almonte | $220,000 | Apex Abstract | |
| Minaya Maria C Luna | $131,000 | Edge Abstract | |
| Farkus Angela Ann | $55,000 | None Available | |
| Federal National Mortgage Association | $2,206 | None Available | |
| Sell David John | -- | None Available | |
| Sell David J | -- | None Available |
Source: Public Records
Mortgage History
| Date | Status | Borrower | Loan Amount |
|---|---|---|---|
| Previous Owner | Minaya Maria C Luna | $128,627 | |
| Previous Owner | Farkus Angela Ann | $54,003 |
Source: Public Records
Tax History
| Year | Tax Paid | Tax Assessment Tax Assessment Total Assessment is a certain percentage of the fair market value that is determined by local assessors to be the total taxable value of land and additions on the property. | Land | Improvement |
|---|---|---|---|---|
| 2026 | $1,616 | $78,700 | $21,900 | $56,800 |
| 2025 | $2,261 | $78,700 | $21,900 | $56,800 |
| 2024 | $2,118 | $78,700 | $21,900 | $56,800 |
| 2023 | $1,980 | $78,700 | $21,900 | $56,800 |
| 2022 | $1,966 | $78,700 | $21,900 | $56,800 |
| 2021 | $1,920 | $78,700 | $21,900 | $56,800 |
| 2020 | $1,715 | $78,700 | $21,900 | $56,800 |
| 2019 | $1,770 | $78,700 | $21,900 | $56,800 |
| 2018 | $1,710 | $78,700 | $21,900 | $56,800 |
| 2017 | $1,576 | $78,700 | $21,900 | $56,800 |
| 2016 | $735 | $78,700 | $21,900 | $56,800 |
| 2015 | $703 | $78,700 | $21,900 | $56,800 |
| 2014 | $703 | $78,700 | $21,900 | $56,800 |
Source: Public Records
Map
Nearby Homes
- 1 W Diamond Ave
- 118 E Green St
- 60 E Jefferson Ave
- 403 W 7th St
- 360 W Spruce St
- 187 N Church St
- 116 N Laurel St
- 127 W Diamond Ave
- 52 N Laurel St
- 239 Lincalis St
- 218 North St
- 829 W 21st St
- 14 W 4th St
- ER.126 W Aspen St
- 897 N Vine St
- 328 W Green St
- 0 Church Unit PALU2002778
- 101 S Wyoming St
- 90 N Cedar St
- Lot 46 Mountain Laurel Dr
Your Personal Tour Guide
Ask me questions while you tour the home.