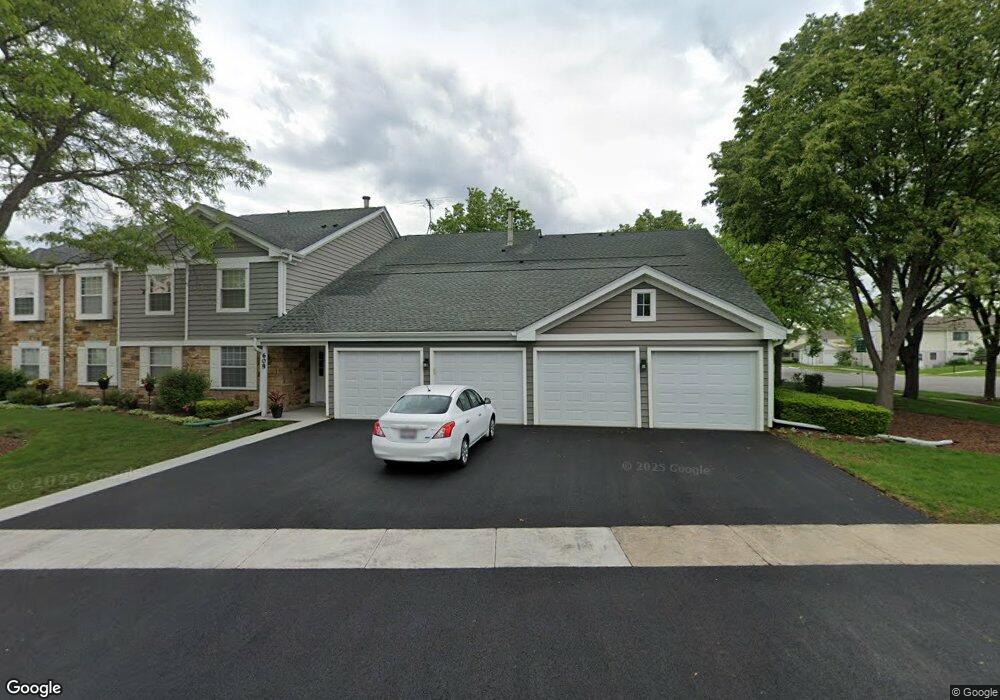
608 Hanover Ct Unit 1821R Schaumburg, IL 60194
East Schaumburg NeighborhoodEstimated Value: $267,000 - $293,000
2
Beds
--
Bath
1,200
Sq Ft
$231/Sq Ft
Est. Value
About This Home
This home is located at 608 Hanover Ct Unit 1821R, Schaumburg, IL 60194 and is currently estimated at $277,142, approximately $230 per square foot. 608 Hanover Ct Unit 1821R is a home located in Cook County with nearby schools including Everett Dirksen Elementary School, Robert Frost Junior High School, and J B Conant High School.
Ownership History
Date
Name
Owned For
Owner Type
Purchase Details
Closed on
Jul 26, 2002
Sold by
Divito Cathy A and Divito Nicole T
Bought by
Divito Carol A
Current Estimated Value
Home Financials for this Owner
Home Financials are based on the most recent Mortgage that was taken out on this home.
Original Mortgage
$132,000
Interest Rate
6.64%
Purchase Details
Closed on
Jul 26, 2000
Sold by
Divito Cathy A
Bought by
Divito Cathy A and Divito Nicole T
Home Financials for this Owner
Home Financials are based on the most recent Mortgage that was taken out on this home.
Original Mortgage
$113,900
Interest Rate
11.3%
Purchase Details
Closed on
Jun 30, 1994
Sold by
Kleiner Janice E and Evans David C
Bought by
Divito Cathy A
Home Financials for this Owner
Home Financials are based on the most recent Mortgage that was taken out on this home.
Original Mortgage
$75,285
Interest Rate
8.72%
Create a Home Valuation Report for This Property
The Home Valuation Report is an in-depth analysis detailing your home's value as well as a comparison with similar homes in the area
Home Values in the Area
Average Home Value in this Area
Purchase History
| Date | Buyer | Sale Price | Title Company |
|---|---|---|---|
| Divito Carol A | -- | -- | |
| Divito Cathy A | -- | Lawyers Title Insurance Corp | |
| Divito Cathy A | $107,600 | -- |
Source: Public Records
Mortgage History
| Date | Status | Borrower | Loan Amount |
|---|---|---|---|
| Previous Owner | Divito Carol A | $132,000 | |
| Previous Owner | Divito Cathy A | $113,900 | |
| Previous Owner | Divito Cathy A | $75,285 |
Source: Public Records
Tax History Compared to Growth
Tax History
| Year | Tax Paid | Tax Assessment Tax Assessment Total Assessment is a certain percentage of the fair market value that is determined by local assessors to be the total taxable value of land and additions on the property. | Land | Improvement |
|---|---|---|---|---|
| 2024 | $1,343 | $17,910 | $5,507 | $12,403 |
| 2023 | $1,343 | $17,910 | $5,507 | $12,403 |
| 2022 | $1,343 | $17,910 | $5,507 | $12,403 |
| 2021 | $1,459 | $14,532 | $7,056 | $7,476 |
| 2020 | $1,336 | $14,532 | $7,056 | $7,476 |
| 2019 | $1,329 | $16,156 | $7,056 | $9,100 |
| 2018 | $1,491 | $11,865 | $5,937 | $5,928 |
| 2017 | $1,442 | $11,865 | $5,937 | $5,928 |
| 2016 | $2,016 | $11,865 | $5,937 | $5,928 |
| 2015 | $2,302 | $12,193 | $5,163 | $7,030 |
| 2014 | $2,848 | $12,193 | $5,163 | $7,030 |
| 2013 | $2,757 | $12,193 | $5,163 | $7,030 |
Source: Public Records
Map
Nearby Homes
- 601 Hanover Ct Unit Z2
- 602 Eastview Ct Unit Z1
- 600 Eastview Ct Unit X1
- 325 Bayview Point Unit 56B
- 121 Chatsworth Cir
- 751 Edgelake Point Unit 68C
- 22 Ascot Cir
- 28 Ascot Cir
- 85 Marble Hill Ct Unit A1
- 350 Newgate Ct Unit 2Z
- 223 Gareth Ln
- 91 Lambert Dr Unit B1
- 802 Stonewall Ct Unit 55
- 287 Pembridge Ln Unit B2
- 465 Apache Ln
- 147 Fulbright Ln
- 153 Fulbright Ln
- 22 Waterbury Ln Unit N1
- 125 Cleveland Ct Unit M2
- 15 Bar Harbour Rd Unit 4F
- 608 Hanover Ct Unit 1821R
- 608 Hanover Ct Unit 1821R
- 608 Hanover Ct Unit 1821R
- 608 Hanover Ct Unit Z2
- 608 Hanover Ct Unit V2
- 608 Hanover Ct Unit Z1
- 606 Hanover Ct Unit X2
- 606 Hanover Ct Unit 1821L
- 606 Hanover Ct Unit 1821L
- 606 Hanover Ct Unit 1821L
- 606 Hanover Ct Unit 1821L
- 606 Hanover Ct Unit W1
- 607 Hanover Ct Unit 1718R
- 607 Hanover Ct Unit 1718R
- 607 Hanover Ct Unit 1718R
- 607 Hanover Ct Unit 1718R
- 607 Hanover Ct Unit V2
- 607 Hanover Ct Unit Z1
- 607 Hanover Ct Unit V1
- 602 Hanover Ct Unit 1820R