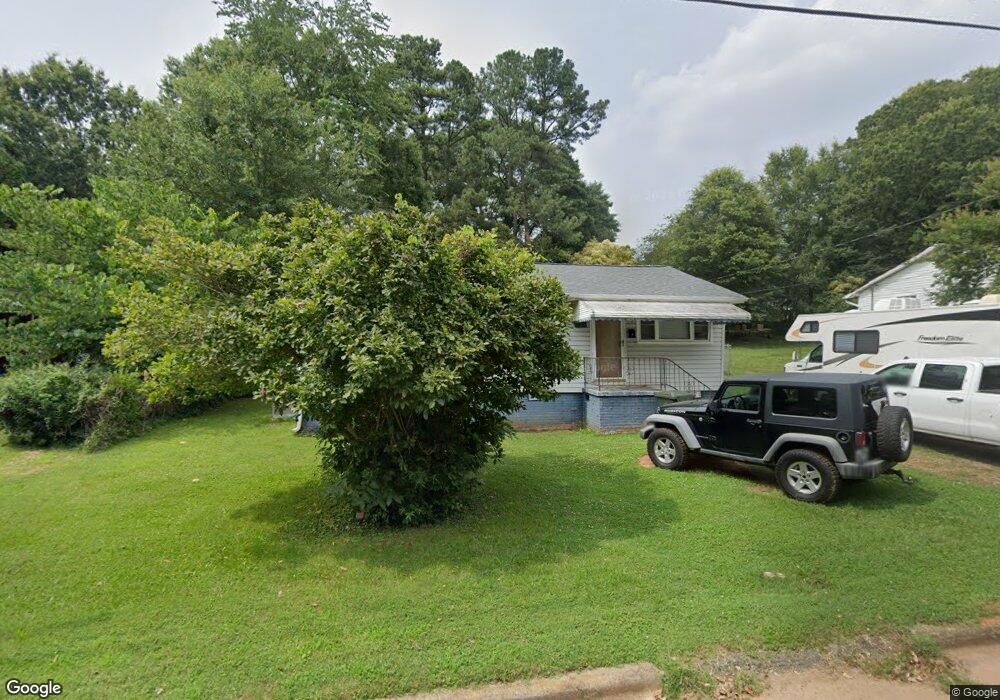
608 Landing St Kings Mountain, NC 28086
Estimated Value: $169,042 - $205,000
3
Beds
1
Bath
912
Sq Ft
$205/Sq Ft
Est. Value
About This Home
This home is located at 608 Landing St, Kings Mountain, NC 28086 and is currently estimated at $186,761, approximately $204 per square foot. 608 Landing St is a home located in Cleveland County with nearby schools including West Elementary School, Kings Mountain Middle, and Kings Mountain Intermediate School.
Ownership History
Date
Name
Owned For
Owner Type
Purchase Details
Closed on
Nov 18, 2010
Sold by
Rosser Janet Melton and Simpson David A
Bought by
Secretary Housing Urban Development
Current Estimated Value
Purchase Details
Closed on
May 30, 2008
Sold by
Rosser Hyle Eugene
Bought by
Rosser Janet Melton
Home Financials for this Owner
Home Financials are based on the most recent Mortgage that was taken out on this home.
Original Mortgage
$79,677
Interest Rate
6%
Mortgage Type
FHA
Purchase Details
Closed on
Jul 14, 2006
Sold by
Head Joseph M and Head Melissa P
Bought by
Rosser Janet Melton and Rosser Flyle Engene
Home Financials for this Owner
Home Financials are based on the most recent Mortgage that was taken out on this home.
Original Mortgage
$67,500
Interest Rate
10.84%
Mortgage Type
Assumption
Create a Home Valuation Report for This Property
The Home Valuation Report is an in-depth analysis detailing your home's value as well as a comparison with similar homes in the area
Home Values in the Area
Average Home Value in this Area
Purchase History
| Date | Buyer | Sale Price | Title Company |
|---|---|---|---|
| Secretary Housing Urban Development | $87,391 | None Available | |
| Rosser Janet Melton | -- | None Available | |
| Rosser Janet Melton | $76,000 | None Available |
Source: Public Records
Mortgage History
| Date | Status | Borrower | Loan Amount |
|---|---|---|---|
| Previous Owner | Rosser Janet Melton | $79,677 | |
| Previous Owner | Rosser Janet Melton | $67,500 | |
| Closed | Rosser Janet Melton | $9,612 |
Source: Public Records
Tax History Compared to Growth
Tax History
| Year | Tax Paid | Tax Assessment Tax Assessment Total Assessment is a certain percentage of the fair market value that is determined by local assessors to be the total taxable value of land and additions on the property. | Land | Improvement |
|---|---|---|---|---|
| 2025 | $661 | $125,607 | $18,187 | $107,420 |
| 2024 | $440 | $69,976 | $12,731 | $57,245 |
| 2023 | $438 | $69,976 | $12,731 | $57,245 |
| 2022 | $803 | $69,976 | $12,731 | $57,245 |
| 2021 | $807 | $69,976 | $12,731 | $57,245 |
| 2020 | $648 | $54,412 | $10,039 | $44,373 |
| 2019 | $648 | $54,412 | $10,039 | $44,373 |
| 2018 | $647 | $54,412 | $10,039 | $44,373 |
| 2017 | $643 | $54,412 | $10,039 | $44,373 |
| 2016 | $644 | $54,412 | $10,039 | $44,373 |
| 2015 | $624 | $54,017 | $8,730 | $45,287 |
| 2014 | $624 | $54,017 | $8,730 | $45,287 |
Source: Public Records
Map
Nearby Homes
- 811 W Gold St Unit 26
- 400 S Cansler St
- 316 S Cansler St
- 106 N Tracy St
- 411 S Battleground Ave
- 300 N Watterson St
- 442 Phifer Rd
- 417 Phifer Rd
- 310 Campbell Cir
- 200 E Gold St
- 208 Victoria Cir
- 207 Morris St
- 110 N Gaston St
- 1301 Shelby Rd
- 430 Fulton Dr
- 5066 Beargrass Dr
- 522 Waco Rd
- 524 Waco Rd
- 112 Fulton Dr
- 117 Parker Claire Ln