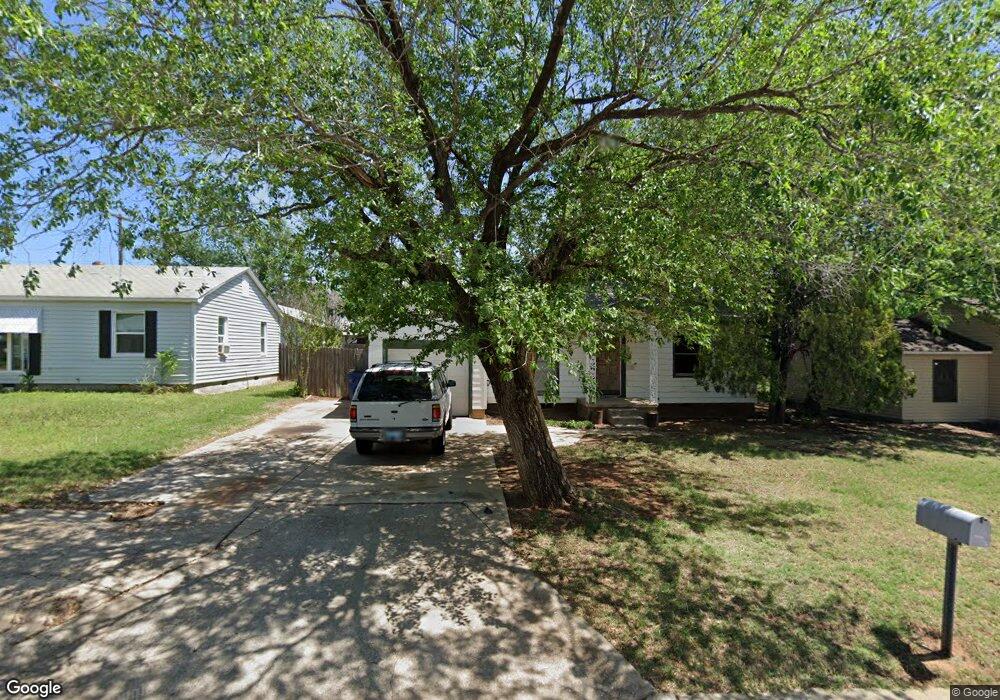
608 N E St Duncan, OK 73533
Estimated Value: $46,460 - $66,000
2
Beds
1
Bath
920
Sq Ft
$62/Sq Ft
Est. Value
About This Home
This home is located at 608 N E St, Duncan, OK 73533 and is currently estimated at $57,365, approximately $62 per square foot. 608 N E St is a home located in Stephens County with nearby schools including Woodrow Wilson Elementary School, Duncan Middle School, and Duncan High School.
Ownership History
Date
Name
Owned For
Owner Type
Purchase Details
Closed on
Mar 28, 2013
Sold by
Mcbride Leon D and Mcbride Betty L
Bought by
Richards Jennifer N and Richards Frederick R
Current Estimated Value
Home Financials for this Owner
Home Financials are based on the most recent Mortgage that was taken out on this home.
Original Mortgage
$27,200
Interest Rate
3.59%
Mortgage Type
Purchase Money Mortgage
Purchase Details
Closed on
Nov 21, 2012
Sold by
Mcbride Julie L
Bought by
Mcbride Leon D and Mcbride Betty L
Purchase Details
Closed on
May 26, 2010
Sold by
Sweeney Peggy Maxine
Bought by
Mcbride Julie L
Purchase Details
Closed on
Jun 25, 2003
Sold by
Sweeney Jody Paul
Purchase Details
Closed on
Jul 26, 2002
Sold by
Paschen Dianne M and Paschen Frank
Purchase Details
Closed on
Jan 5, 1998
Sold by
Rolls Leonard C
Purchase Details
Closed on
Apr 29, 1993
Sold by
Martin Nicky Ray
Create a Home Valuation Report for This Property
The Home Valuation Report is an in-depth analysis detailing your home's value as well as a comparison with similar homes in the area
Purchase History
| Date | Buyer | Sale Price | Title Company |
|---|---|---|---|
| Richards Jennifer N | $34,000 | None Available | |
| Mcbride Leon D | -- | None Available | |
| Mcbride Julie L | $36,000 | None Available | |
| -- | -- | -- | |
| -- | $18,000 | -- | |
| -- | $15,000 | -- | |
| -- | -- | -- |
Source: Public Records
Mortgage History
| Date | Status | Borrower | Loan Amount |
|---|---|---|---|
| Closed | Richards Jennifer N | $27,200 |
Source: Public Records
Tax History
| Year | Tax Paid | Tax Assessment Tax Assessment Total Assessment is a certain percentage of the fair market value that is determined by local assessors to be the total taxable value of land and additions on the property. | Land | Improvement |
|---|---|---|---|---|
| 2025 | $374 | $4,440 | $494 | $3,946 |
| 2024 | $223 | $2,622 | $494 | $2,128 |
| 2023 | $223 | $2,622 | $494 | $2,128 |
| 2022 | $202 | $2,379 | $494 | $1,885 |
| 2021 | $210 | $2,475 | $494 | $1,981 |
| 2020 | $242 | $2,802 | $494 | $2,308 |
| 2019 | $243 | $2,805 | $494 | $2,311 |
| 2018 | $250 | $2,805 | $494 | $2,311 |
| 2017 | $236 | $2,743 | $494 | $2,249 |
| 2016 | $321 | $3,772 | $494 | $3,278 |
| 2015 | $222 | $3,772 | $494 | $3,278 |
| 2014 | $222 | $3,772 | $494 | $3,278 |
Source: Public Records
Map
Nearby Homes
Your Personal Tour Guide
Ask me questions while you tour the home.