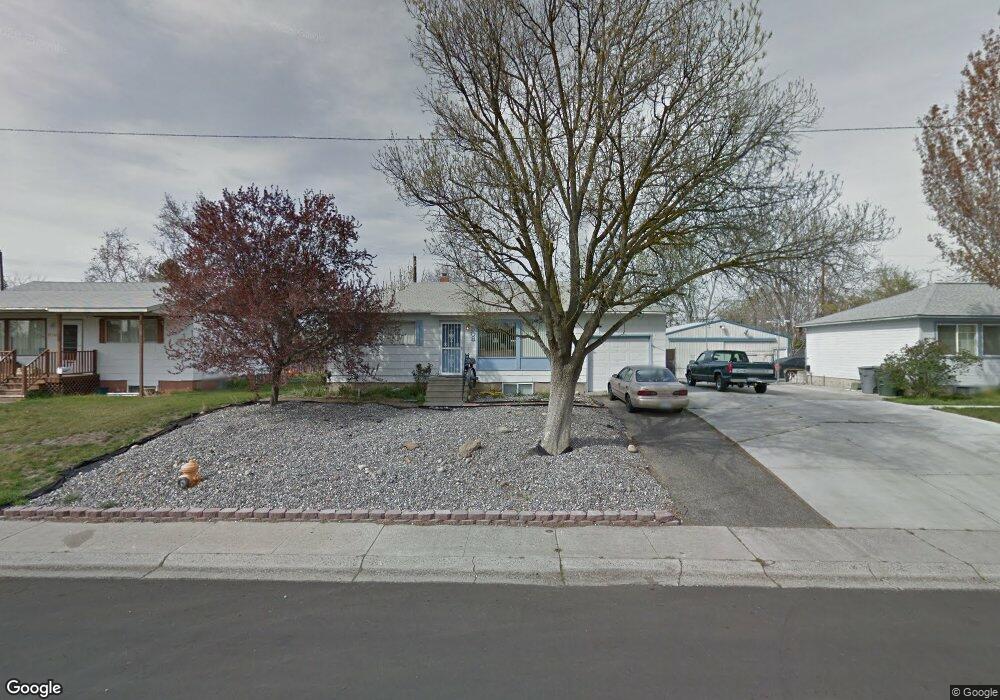
608 Newcomer St Richland, WA 99354
Estimated Value: $342,020 - $405,000
4
Beds
2
Baths
1,789
Sq Ft
$205/Sq Ft
Est. Value
About This Home
This home is located at 608 Newcomer St, Richland, WA 99354 and is currently estimated at $367,505, approximately $205 per square foot. 608 Newcomer St is a home located in Benton County with nearby schools including Sacajawea Elementary School, Chief Joseph Middle School, and Hanford High School.
Ownership History
Date
Name
Owned For
Owner Type
Purchase Details
Closed on
Apr 11, 2008
Sold by
Jakob Page Mary L
Bought by
Kempton Thomas W and Kempton Tammy A
Current Estimated Value
Home Financials for this Owner
Home Financials are based on the most recent Mortgage that was taken out on this home.
Original Mortgage
$136,356
Interest Rate
5.17%
Mortgage Type
VA
Purchase Details
Closed on
May 26, 2005
Sold by
Page Timothy W
Bought by
Jakob Page Mary L
Home Financials for this Owner
Home Financials are based on the most recent Mortgage that was taken out on this home.
Original Mortgage
$11,700
Interest Rate
5.41%
Mortgage Type
Stand Alone Second
Purchase Details
Closed on
May 24, 2005
Sold by
Leitz Erlan Mark and Leitz Janice G
Bought by
Jakob Page Mary L
Home Financials for this Owner
Home Financials are based on the most recent Mortgage that was taken out on this home.
Original Mortgage
$11,700
Interest Rate
5.41%
Mortgage Type
Stand Alone Second
Create a Home Valuation Report for This Property
The Home Valuation Report is an in-depth analysis detailing your home's value as well as a comparison with similar homes in the area
Home Values in the Area
Average Home Value in this Area
Purchase History
| Date | Buyer | Sale Price | Title Company |
|---|---|---|---|
| Kempton Thomas W | $132,000 | Chicago Title | |
| Jakob Page Mary L | -- | Chicago Title | |
| Jakob Page Mary L | $93,600 | Chicago Title |
Source: Public Records
Mortgage History
| Date | Status | Borrower | Loan Amount |
|---|---|---|---|
| Previous Owner | Kempton Thomas W | $136,356 | |
| Previous Owner | Jakob Page Mary L | $11,700 | |
| Previous Owner | Jakob Page Mary L | $93,600 |
Source: Public Records
Tax History Compared to Growth
Tax History
| Year | Tax Paid | Tax Assessment Tax Assessment Total Assessment is a certain percentage of the fair market value that is determined by local assessors to be the total taxable value of land and additions on the property. | Land | Improvement |
|---|---|---|---|---|
| 2024 | $2,965 | $282,060 | $50,000 | $232,060 |
| 2023 | $2,965 | $315,220 | $50,000 | $265,220 |
| 2022 | $2,530 | $273,780 | $50,000 | $223,780 |
| 2021 | $2,212 | $227,810 | $50,000 | $177,810 |
| 2020 | $2,191 | $191,130 | $50,000 | $141,130 |
| 2019 | $1,742 | $179,020 | $28,000 | $151,020 |
| 2018 | $1,798 | $152,980 | $28,000 | $124,980 |
| 2017 | $1,578 | $132,150 | $28,000 | $104,150 |
| 2016 | -- | $132,150 | $28,000 | $104,150 |
| 2015 | $1,527 | $132,150 | $28,000 | $104,150 |
| 2014 | -- | $127,300 | $28,000 | $99,300 |
| 2013 | -- | $127,300 | $28,000 | $99,300 |
Source: Public Records
Map
Nearby Homes
- 515 Blue St
- 517 Catskill St
- 1962 Mahan Ave
- 2021 Mahan Ave Unit J-6
- 2021 Mahan Ave Unit D8
- 2021 Mahan Ave Unit A5
- 2021 Mahan Ave Unit I8
- 2021 Mahan Ave Unit H-7
- 2021 Mahan Ave Unit M7
- 2021 Mahan Ave Unit G1
- 1914 Mahan Ave
- 1920 Howell Ave
- 1910 Forest Ave
- 1980 Forest Ave
- 78 Whitten St
- 1948 Cypress Place
- 1947 Hetrick St
- 2110 Davison Ave
- 1609 Judson Ave
- 324 Saint St