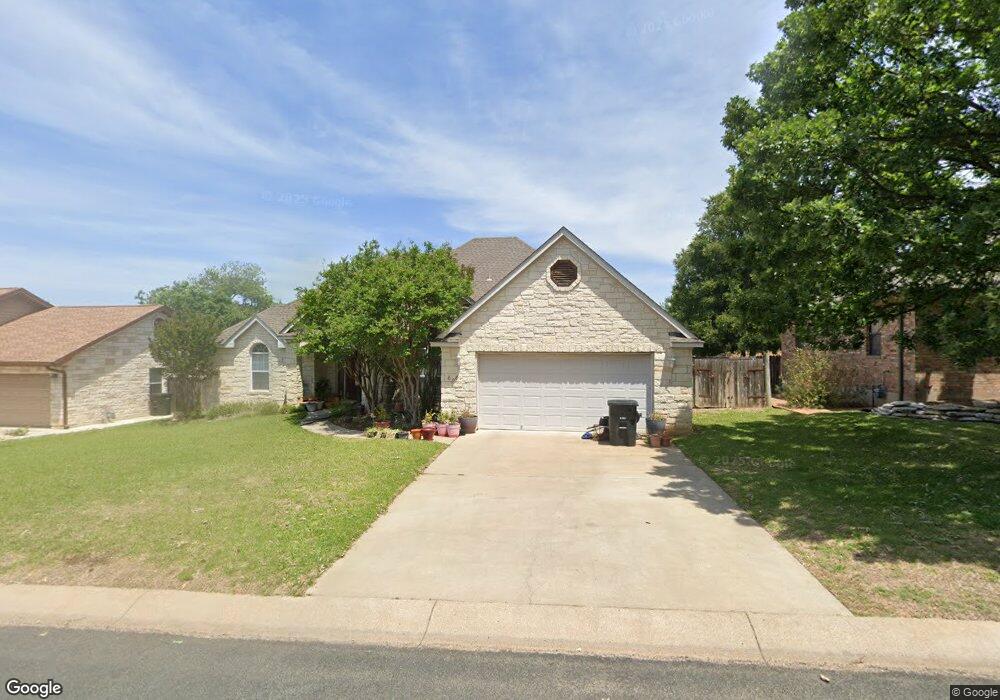
608 Paintbrush Hollow St Fredericksburg, TX 78624
Estimated Value: $541,000 - $607,000
3
Beds
2
Baths
2,010
Sq Ft
$280/Sq Ft
Est. Value
About This Home
This home is located at 608 Paintbrush Hollow St, Fredericksburg, TX 78624 and is currently estimated at $563,694, approximately $280 per square foot. 608 Paintbrush Hollow St is a home located in Gillespie County with nearby schools including Fredericksburg High School, Ambleside School of Fredericksburg, and St. Mary's Catholic School.
Ownership History
Date
Name
Owned For
Owner Type
Purchase Details
Closed on
Jan 24, 2020
Sold by
Dietrich Jeanne
Bought by
Dietrich Derrick
Current Estimated Value
Purchase Details
Closed on
Jul 23, 2008
Sold by
Dunlap James K and Dunlap Dana N
Bought by
Dietrich Dereick and Dietrich Wwendy
Home Financials for this Owner
Home Financials are based on the most recent Mortgage that was taken out on this home.
Original Mortgage
$252,952
Interest Rate
6.36%
Purchase Details
Closed on
Jul 28, 2005
Sold by
Williams Linda D and Upshaw Paul B
Bought by
Dunlap James K and Dunlap Dana N
Home Financials for this Owner
Home Financials are based on the most recent Mortgage that was taken out on this home.
Original Mortgage
$183,200
Interest Rate
5.61%
Create a Home Valuation Report for This Property
The Home Valuation Report is an in-depth analysis detailing your home's value as well as a comparison with similar homes in the area
Home Values in the Area
Average Home Value in this Area
Purchase History
| Date | Buyer | Sale Price | Title Company |
|---|---|---|---|
| Dietrich Derrick | -- | None Available | |
| Dietrich Dereick | -- | None Available | |
| Dunlap James K | -- | None Available |
Source: Public Records
Mortgage History
| Date | Status | Borrower | Loan Amount |
|---|---|---|---|
| Previous Owner | Dietrich Dereick | $252,952 | |
| Previous Owner | Dunlap James K | $183,200 |
Source: Public Records
Tax History Compared to Growth
Tax History
| Year | Tax Paid | Tax Assessment Tax Assessment Total Assessment is a certain percentage of the fair market value that is determined by local assessors to be the total taxable value of land and additions on the property. | Land | Improvement |
|---|---|---|---|---|
| 2025 | $7,201 | $575,231 | $171,170 | $406,530 |
| 2024 | $7,201 | $522,937 | $171,170 | $406,530 |
| 2023 | $5,824 | $475,397 | $171,170 | $406,530 |
| 2022 | $6,459 | $472,520 | $116,800 | $355,720 |
| 2021 | $6,628 | $392,890 | $67,520 | $325,370 |
| 2020 | $6,258 | $363,350 | $62,430 | $300,920 |
| 2019 | $6,492 | $363,350 | $62,430 | $300,920 |
| 2018 | $6,159 | $346,210 | $62,430 | $283,780 |
| 2017 | $6,013 | $334,550 | $62,430 | $272,120 |
| 2016 | $5,467 | $298,980 | $51,830 | $247,150 |
| 2015 | -- | $287,330 | $51,830 | $235,500 |
| 2014 | -- | $263,210 | $39,290 | $223,920 |
Source: Public Records
Map
Nearby Homes
- 605 Persimmon Ct
- 605 Lupine Ln
- 805 Lupine Ln Unit 3
- 811 Lupine Ln Unit 6
- 819 Lupine Ln Unit 10
- 803 Lupine Ln Unit 2
- 809 Lupine Ln Unit 5
- 815 Lupine Ln Unit 8
- 813 Lupine Ln Unit 7
- 817 Lupine Ln Unit 9
- 801 Lupine Ln Unit 1
- 1207 Running Buck Ln
- 1212 Doe Run Hollow
- 500 Cross Mountain Dr
- 1013 Avenue B Unit 6
- 1011 Avenue C
- 600 Bunny Dr
- 406 Cross Mountain Dr
- 612 W Hackberry St
- 000 Ranch Road 965
- 608 Paintbrush Hollow
- 606 Paintbrush Hollow St
- 610 Paintbrush Hollow St
- 0 Paintbrush Hollow Unit 16 10505
- 0 Paintbrush Hollow Unit 13 10514
- 0 Paintbrush Hollow Unit 17 10527
- 0 Paintbrush Hollow Unit 5 15418
- 0 Paintbrush Hollow Unit 12 10513
- 0 Paintbrush Hollow Unit 15 10508
- 0 Paintbrush Hollow Unit 5
- 0 Paintbrush Hollow Unit 10
- 607 Persimmon Ct
- 609 Persimmon Ct
- 612 Paintbrush Hollow St
- 604 Paintbrush Hollow St
- 607 Paintbrush Hollow St
- 609 Paintbrush Hollow St
- 605 Paintbrush Hollow St
- 611 Persimmon Ct
- 603 Persimmon Ct