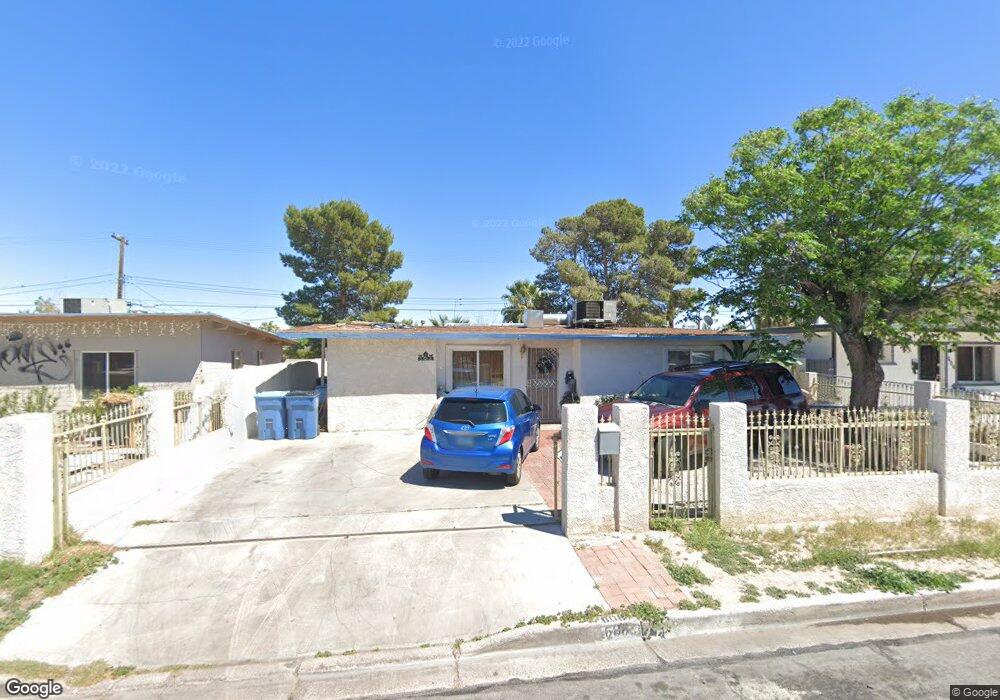
608 Princeton St Las Vegas, NV 89107
Michael Way NeighborhoodEstimated Value: $314,775 - $349,000
3
Beds
1
Bath
1,292
Sq Ft
$257/Sq Ft
Est. Value
About This Home
This home is located at 608 Princeton St, Las Vegas, NV 89107 and is currently estimated at $332,444, approximately $257 per square foot. 608 Princeton St is a home located in Clark County with nearby schools including J.T. McWlliams Elementary School, Robert O Gibson Middle School, and Western High School.
Ownership History
Date
Name
Owned For
Owner Type
Purchase Details
Closed on
Jan 18, 2000
Sold by
Ayala Florencia E
Bought by
Bahena Celso Arteaga
Current Estimated Value
Home Financials for this Owner
Home Financials are based on the most recent Mortgage that was taken out on this home.
Original Mortgage
$92,735
Outstanding Balance
$29,464
Interest Rate
7.84%
Mortgage Type
FHA
Estimated Equity
$302,980
Purchase Details
Closed on
Dec 2, 1999
Sold by
Foster Deana L
Bought by
Bahena Celso Arteaga
Home Financials for this Owner
Home Financials are based on the most recent Mortgage that was taken out on this home.
Original Mortgage
$92,735
Outstanding Balance
$29,464
Interest Rate
7.84%
Mortgage Type
FHA
Estimated Equity
$302,980
Purchase Details
Closed on
Jan 20, 1995
Sold by
Davis Earl J and Davis Debra Ann
Bought by
Foster Deana
Home Financials for this Owner
Home Financials are based on the most recent Mortgage that was taken out on this home.
Original Mortgage
$67,450
Interest Rate
9.28%
Create a Home Valuation Report for This Property
The Home Valuation Report is an in-depth analysis detailing your home's value as well as a comparison with similar homes in the area
Home Values in the Area
Average Home Value in this Area
Purchase History
| Date | Buyer | Sale Price | Title Company |
|---|---|---|---|
| Bahena Celso Arteaga | $93,500 | Fidelity National Title | |
| Bahena Celso Arteaga | $93,500 | Fidelity National Title | |
| Foster Deana | $71,000 | United Title |
Source: Public Records
Mortgage History
| Date | Status | Borrower | Loan Amount |
|---|---|---|---|
| Open | Bahena Celso Arteaga | $92,735 | |
| Previous Owner | Foster Deana | $67,450 |
Source: Public Records
Tax History Compared to Growth
Tax History
| Year | Tax Paid | Tax Assessment Tax Assessment Total Assessment is a certain percentage of the fair market value that is determined by local assessors to be the total taxable value of land and additions on the property. | Land | Improvement |
|---|---|---|---|---|
| 2025 | $932 | $42,025 | $25,200 | $16,825 |
| 2024 | $864 | $42,025 | $25,200 | $16,825 |
| 2023 | $864 | $41,055 | $25,900 | $15,155 |
| 2022 | $800 | $34,560 | $21,000 | $13,560 |
| 2021 | $741 | $30,773 | $18,200 | $12,573 |
| 2020 | $685 | $27,294 | $15,050 | $12,244 |
| 2019 | $642 | $26,886 | $15,050 | $11,836 |
| 2018 | $613 | $21,562 | $10,500 | $11,062 |
| 2017 | $681 | $20,761 | $9,800 | $10,961 |
| 2016 | $575 | $18,905 | $7,000 | $11,905 |
| 2015 | $572 | $17,410 | $5,250 | $12,160 |
| 2014 | $556 | $16,446 | $3,780 | $12,666 |
Source: Public Records
Map
Nearby Homes
- 609 Harvard St
- 605 N Yale St
- 604 N Minnesota St
- 424 Stanford St
- 324 Princeton St
- 5004 Cannon Blvd
- 304 N Minnesota St
- 704 McDermit St
- 116 Princeton St
- 104 Stanford St
- 601 Huntington St
- 5305 Sugarfoot Ave
- 1124 Nassau Dr Unit 4
- 5400 Maddox Ave
- 812 Hogan Dr
- 5420 Moonstruck Ave
- 4405 Hanford Ave
- 4913 Churchill Ave
- 600 Woodmount Dr
- 4317 Hanford Ave
- 612 Princeton St
- 604 Princeton St
- 616 Princeton St
- 613 Harvard St
- 605 Harvard St
- 609 Princeton St
- 617 Harvard St
- 4900 Vermont Ave
- 605 Princeton St
- 613 Princeton St
- 620 Princeton St
- 4922 Vermont Ave
- 617 Princeton St
- 621 Harvard St
- 4913 Vermont Ave
- 700 Princeton St
- 621 Princeton St
- 4901 Vermont Ave
- 4923 Vermont Ave