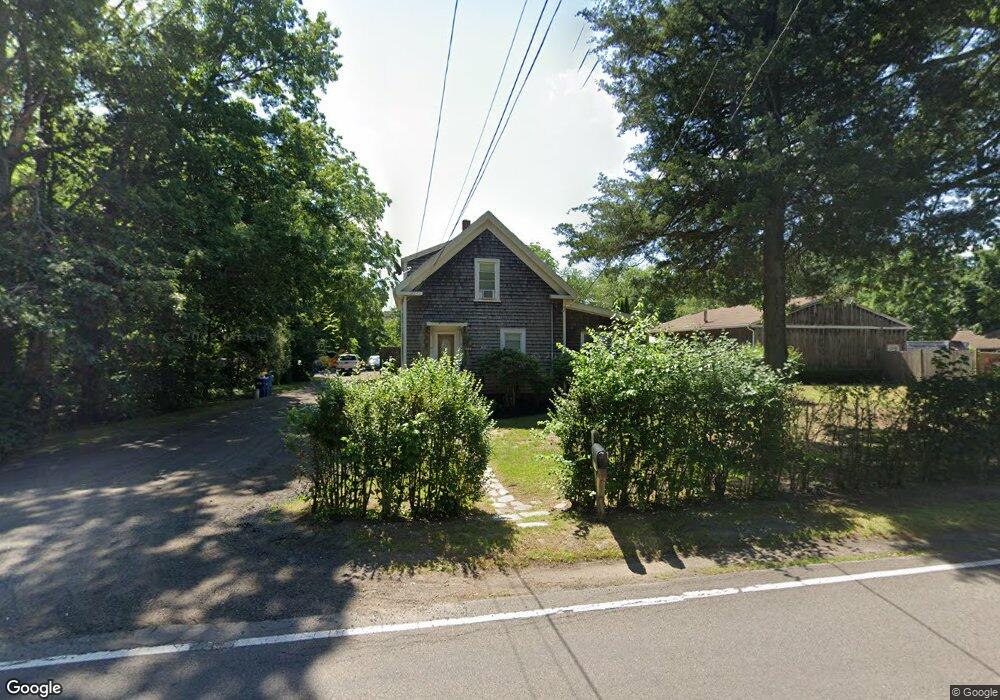
608 Spring St Unit 1 East Bridgewater, MA 02333
Estimated Value: $677,395
--
Bed
1
Bath
1,798
Sq Ft
$377/Sq Ft
Est. Value
About This Home
This home is located at 608 Spring St Unit 1, East Bridgewater, MA 02333 and is currently estimated at $677,395, approximately $376 per square foot. 608 Spring St Unit 1 is a home located in Plymouth County with nearby schools including Gordon W Mitchell Middle School, East Bridgewater Jr./Sr. High School, and New England Baptist Academy.
Ownership History
Date
Name
Owned For
Owner Type
Purchase Details
Closed on
Nov 20, 2020
Sold by
Miller Diane
Bought by
Marylu Llc
Current Estimated Value
Home Financials for this Owner
Home Financials are based on the most recent Mortgage that was taken out on this home.
Original Mortgage
$250,000
Outstanding Balance
$221,956
Interest Rate
2.8%
Mortgage Type
Commercial
Estimated Equity
$455,439
Purchase Details
Closed on
Apr 30, 2003
Sold by
Mccann Ft and Mccann Maureen A
Bought by
Miller Elmer J and Miller Diane
Home Financials for this Owner
Home Financials are based on the most recent Mortgage that was taken out on this home.
Original Mortgage
$243,000
Interest Rate
5.82%
Mortgage Type
Commercial
Purchase Details
Closed on
Dec 29, 1989
Sold by
Mccann Richard K
Bought by
Mccann Paul R
Create a Home Valuation Report for This Property
The Home Valuation Report is an in-depth analysis detailing your home's value as well as a comparison with similar homes in the area
Home Values in the Area
Average Home Value in this Area
Purchase History
| Date | Buyer | Sale Price | Title Company |
|---|---|---|---|
| Marylu Llc | $500,000 | None Available | |
| Miller Elmer J | $270,000 | -- | |
| Miller Elmer J | $270,000 | -- | |
| Mccann Paul R | $140,151 | -- | |
| Mccann Paul R | $140,151 | -- |
Source: Public Records
Mortgage History
| Date | Status | Borrower | Loan Amount |
|---|---|---|---|
| Open | Marylu Llc | $250,000 | |
| Previous Owner | Mccann Paul R | $245,000 | |
| Previous Owner | Mccann Paul R | $243,000 |
Source: Public Records
Tax History Compared to Growth
Tax History
| Year | Tax Paid | Tax Assessment Tax Assessment Total Assessment is a certain percentage of the fair market value that is determined by local assessors to be the total taxable value of land and additions on the property. | Land | Improvement |
|---|---|---|---|---|
| 2025 | $6,769 | $495,200 | $181,400 | $313,800 |
| 2024 | $6,593 | $476,400 | $174,500 | $301,900 |
| 2023 | $6,336 | $438,500 | $174,500 | $264,000 |
| 2022 | $6,384 | $409,200 | $158,700 | $250,500 |
| 2021 | $6,174 | $362,100 | $144,500 | $217,600 |
| 2020 | $5,956 | $344,500 | $131,200 | $213,300 |
| 2019 | $5,663 | $322,500 | $125,400 | $197,100 |
| 2018 | $5,216 | $290,400 | $118,000 | $172,400 |
| 2017 | $5,067 | $276,900 | $112,500 | $164,400 |
| 2016 | $5,021 | $276,500 | $119,600 | $156,900 |
| 2015 | $5,213 | $293,500 | $139,700 | $153,800 |
| 2014 | $4,987 | $287,100 | $136,800 | $150,300 |
Source: Public Records
Map
Nearby Homes
- 245-r Laurel St
- 6 Andrea Way
- 603 East St
- 324 W Union St
- 590 Bedford St
- 505 N Central St
- 391 Bedford St
- 386 Bedford St
- 34 Captain Carlson Way
- 16 Pearl St
- 580 Broad St Unit 1
- 580 Broad St Unit 2
- 38 Leland St
- 11 Willow Ave
- 54 Plymouth St
- 192 S Main St
- 386 Matfield St
- 22 Water St
- 60 Miranda Way
- 30 Keenan St