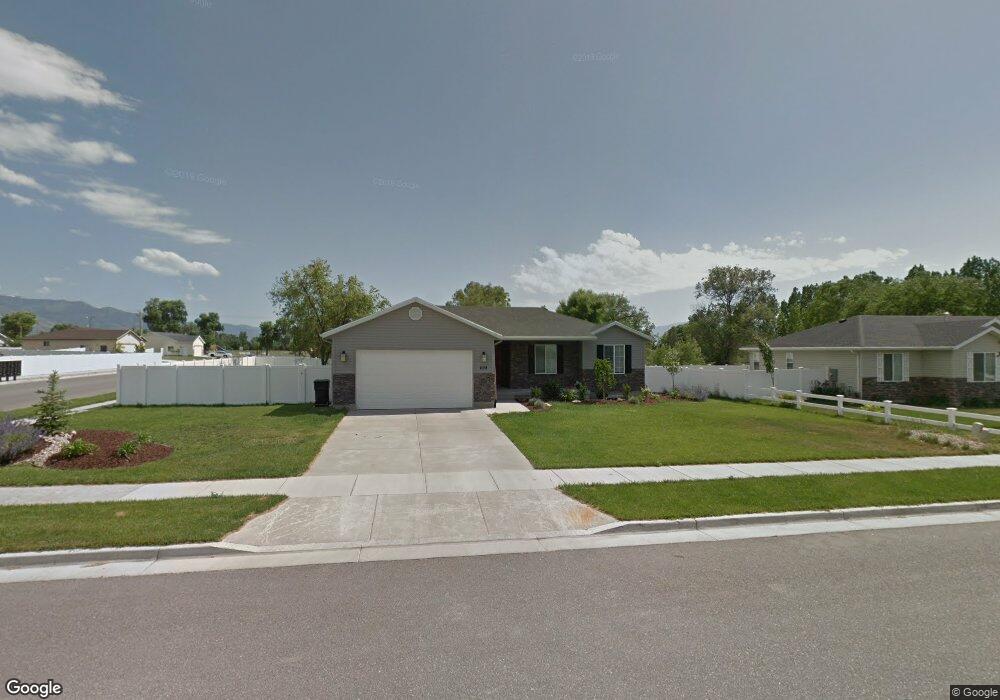
608 W 160 N Smithfield, UT 84335
Estimated Value: $480,000 - $520,000
6
Beds
3
Baths
2,574
Sq Ft
$194/Sq Ft
Est. Value
About This Home
This home is located at 608 W 160 N, Smithfield, UT 84335 and is currently estimated at $498,123, approximately $193 per square foot. 608 W 160 N is a home located in Cache County with nearby schools including Birch Creek School, North Cache Middle School, and White Pine Middle School.
Ownership History
Date
Name
Owned For
Owner Type
Purchase Details
Closed on
Sep 9, 2019
Sold by
Manley Mackay S and Manley Jennifer
Bought by
Teeples Troy D and Teeples Bethany L
Current Estimated Value
Home Financials for this Owner
Home Financials are based on the most recent Mortgage that was taken out on this home.
Original Mortgage
$190,000
Outstanding Balance
$125,339
Interest Rate
3.7%
Mortgage Type
New Conventional
Estimated Equity
$372,784
Purchase Details
Closed on
Jun 16, 2010
Sold by
Neighborhood Nonprofit Housing Corporati
Bought by
Manley Mackay S and Manley Jennifer
Home Financials for this Owner
Home Financials are based on the most recent Mortgage that was taken out on this home.
Original Mortgage
$153,452
Interest Rate
4.99%
Mortgage Type
Purchase Money Mortgage
Purchase Details
Closed on
Apr 14, 2010
Sold by
Acf Development Llc
Bought by
Neighborhood Nonprofit Housing Corporati
Create a Home Valuation Report for This Property
The Home Valuation Report is an in-depth analysis detailing your home's value as well as a comparison with similar homes in the area
Home Values in the Area
Average Home Value in this Area
Purchase History
| Date | Buyer | Sale Price | Title Company |
|---|---|---|---|
| Teeples Troy D | -- | Advanced Title | |
| Manley Mackay S | -- | Cache Title Company | |
| Neighborhood Nonprofit Housing Corporati | -- | Cache Title Company |
Source: Public Records
Mortgage History
| Date | Status | Borrower | Loan Amount |
|---|---|---|---|
| Open | Teeples Troy D | $190,000 | |
| Previous Owner | Manley Mackay S | $153,452 |
Source: Public Records
Tax History
| Year | Tax Paid | Tax Assessment Tax Assessment Total Assessment is a certain percentage of the fair market value that is determined by local assessors to be the total taxable value of land and additions on the property. | Land | Improvement |
|---|---|---|---|---|
| 2025 | $1,931 | $258,445 | $0 | $0 |
| 2024 | $2,069 | $259,785 | $0 | $0 |
| 2023 | $2,165 | $257,070 | $0 | $0 |
| 2022 | $2,200 | $257,070 | $0 | $0 |
| 2021 | $1,946 | $347,380 | $70,000 | $277,380 |
| 2020 | $1,869 | $311,200 | $70,000 | $241,200 |
| 2019 | $1,521 | $241,392 | $45,000 | $196,392 |
| 2018 | $1,435 | $220,350 | $45,000 | $175,350 |
| 2017 | $1,390 | $116,600 | $0 | $0 |
| 2016 | $1,415 | $86,300 | $0 | $0 |
| 2015 | $1,051 | $86,300 | $0 | $0 |
| 2014 | $1,031 | $86,300 | $0 | $0 |
| 2013 | -- | $87,785 | $0 | $0 |
Source: Public Records
Map
Nearby Homes
- 608 W 160 N Unit 3
- 622 W 160 N
- 137 N 600 W Unit 2
- 137 N 600 W
- 155 N 580 W
- 609 W 160 N
- 638 W 160 N Unit 5
- 623 W 160 N Unit 13
- 143 N 580 W
- 178 N 600 W
- 639 W 160 N Unit 12
- 629 W 100 N
- 126 N 600 W Unit 20
- 126 N 600 W
- 654 W 160 N Unit 6
- 113 N 600 W
- 603 W 100 N Unit 1
- 581 W 160 N Unit 35
- 612 W 200 N
- 611 W 100 N Unit 2
Your Personal Tour Guide
Ask me questions while you tour the home.