Estimated Value: $498,000 - $592,000
--
Bed
--
Bath
1,702
Sq Ft
$311/Sq Ft
Est. Value
About This Home
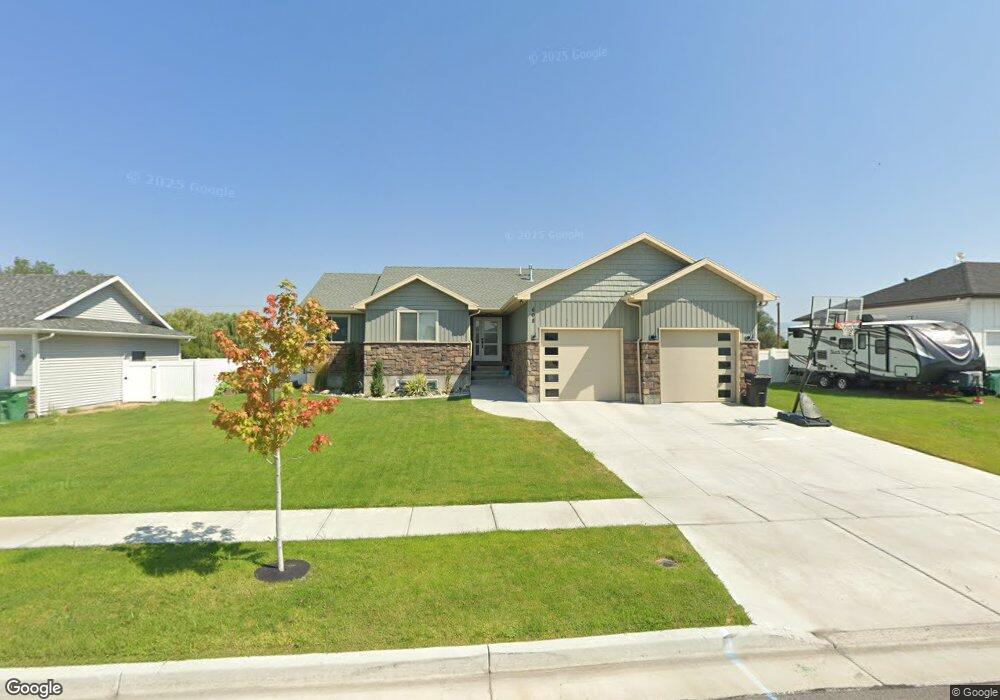
This home is located at 608 W 275 N Unit 204, Hyrum, UT 84319 and is currently estimated at $529,150, approximately $310 per square foot. 608 W 275 N Unit 204 is a home located in Cache County with nearby schools including Lincoln School, South Cache Middle School, and Mountain Crest High School.
Ownership History
Date
Name
Owned For
Owner Type
Purchase Details
Closed on
Feb 19, 2020
Sold by
3D S Construction Inc
Bought by
Martin Kris and Martin Ashley
Current Estimated Value
Home Financials for this Owner
Home Financials are based on the most recent Mortgage that was taken out on this home.
Original Mortgage
$145,000
Outstanding Balance
$128,113
Interest Rate
3.6%
Mortgage Type
New Conventional
Estimated Equity
$401,037
Purchase Details
Closed on
Aug 6, 2018
Sold by
May Jon
Bought by
3 D S Construction Inc
Home Financials for this Owner
Home Financials are based on the most recent Mortgage that was taken out on this home.
Original Mortgage
$257,100
Interest Rate
4.5%
Mortgage Type
Construction
Purchase Details
Closed on
Jun 29, 2018
Sold by
Chrs Development Group Llc
Bought by
May Jon
Home Financials for this Owner
Home Financials are based on the most recent Mortgage that was taken out on this home.
Original Mortgage
$257,100
Interest Rate
4.5%
Mortgage Type
Construction
Create a Home Valuation Report for This Property
The Home Valuation Report is an in-depth analysis detailing your home's value as well as a comparison with similar homes in the area
Home Values in the Area
Average Home Value in this Area
Purchase History
| Date | Buyer | Sale Price | Title Company |
|---|---|---|---|
| Martin Kris | -- | First American Fashion Point | |
| 3 D S Construction Inc | -- | Inwest Title Services Inc Lo | |
| May Jon | -- | Stewart Title Insurance Agen |
Source: Public Records
Mortgage History
| Date | Status | Borrower | Loan Amount |
|---|---|---|---|
| Open | Martin Kris | $145,000 | |
| Previous Owner | 3 D S Construction Inc | $257,100 |
Source: Public Records
Tax History Compared to Growth
Tax History
| Year | Tax Paid | Tax Assessment Tax Assessment Total Assessment is a certain percentage of the fair market value that is determined by local assessors to be the total taxable value of land and additions on the property. | Land | Improvement |
|---|---|---|---|---|
| 2025 | $211 | $303,245 | $0 | $0 |
| 2024 | $2,039 | $273,395 | $0 | $0 |
| 2023 | $2,356 | $302,060 | $0 | $0 |
| 2022 | $2,459 | $302,060 | $0 | $0 |
| 2021 | $1,937 | $366,755 | $75,000 | $291,755 |
| 2020 | $1,851 | $328,700 | $75,000 | $253,700 |
| 2019 | $1,240 | $207,200 | $63,000 | $144,200 |
| 2018 | $833 | $74,000 | $74,000 | $0 |
Source: Public Records
Map
Nearby Homes
- 608 W 275 N
- 626 W 275 N Unit 203
- 594 W 275 N Unit 205
- 594 W 275 N
- 644 W 275 N Unit 202
- 589 W 275 N Unit 207
- 578 W 275 N Unit 206
- 603 W 275 N Unit 208
- 621 W 275 N Unit 209
- 641 W 275 N Unit 210
- 606 W 225 N Unit 215
- 606 W 225 N
- 592 W 225 N
- 592 W 225 N Unit 216
- 624 W 225 N Unit 214
- 659 W 275 N Unit 211
- 642 W 225 N
- 587 W 300 N
- 278 675 W
- 278 N 675 W