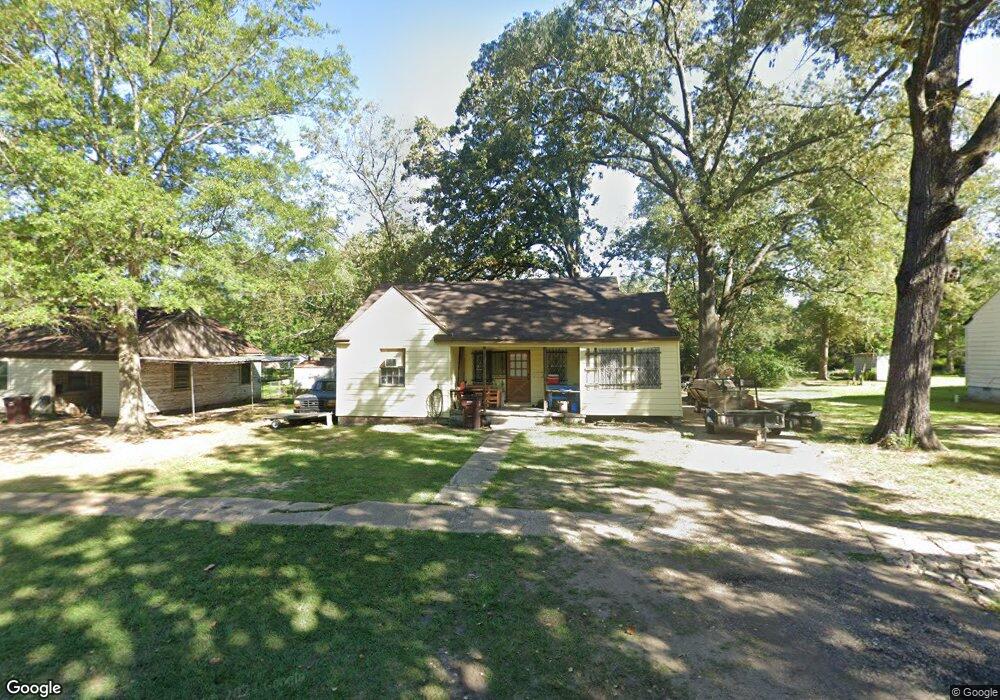
608 W 9th Ave Crossett, AR 71635
Estimated Value: $36,637 - $152,000
--
Bed
1
Bath
1,093
Sq Ft
$72/Sq Ft
Est. Value
About This Home
This home is located at 608 W 9th Ave, Crossett, AR 71635 and is currently estimated at $79,159, approximately $72 per square foot. 608 W 9th Ave is a home located in Ashley County with nearby schools including Crossett Elementary School, Crossett Middle School, and Crossett High School.
Ownership History
Date
Name
Owned For
Owner Type
Purchase Details
Closed on
Dec 6, 2024
Sold by
Reeme David J
Bought by
Kelley Tammy
Current Estimated Value
Purchase Details
Closed on
Apr 25, 2024
Sold by
Williams Corey
Bought by
Reeme David J
Purchase Details
Closed on
Apr 2, 2020
Sold by
Hodge Glen T and Hodge Valerie
Bought by
Williams Corey B
Purchase Details
Closed on
Apr 26, 2001
Bought by
Hodge Glen and Hodge Valerie
Purchase Details
Closed on
Mar 10, 1997
Bought by
Hodge & Jones Investments Llc
Purchase Details
Closed on
Dec 16, 1996
Bought by
Hodge & Jones Investments Llc
Purchase Details
Closed on
Oct 28, 1996
Bought by
Hodge Thomas Glenn
Purchase Details
Closed on
Jul 1, 1985
Bought by
Wilson Randall and Wilson Callie H
Purchase Details
Closed on
Jul 14, 1965
Bought by
Wilson Randall and Wilson Brenda H
Create a Home Valuation Report for This Property
The Home Valuation Report is an in-depth analysis detailing your home's value as well as a comparison with similar homes in the area
Home Values in the Area
Average Home Value in this Area
Purchase History
| Date | Buyer | Sale Price | Title Company |
|---|---|---|---|
| Kelley Tammy | $9,000 | None Listed On Document | |
| Reeme David J | $9,000 | None Listed On Document | |
| Reeme David J | $9,000 | None Listed On Document | |
| Williams Corey B | -- | None Available | |
| Hodge Glen | -- | -- | |
| Hodge & Jones Investments Llc | $1,000 | -- | |
| Hodge & Jones Investments Llc | $1,000 | -- | |
| Hodge Thomas Glenn | $25,000 | -- | |
| Wilson Randall | -- | -- | |
| Wilson Randall | -- | -- |
Source: Public Records
Tax History Compared to Growth
Tax History
| Year | Tax Paid | Tax Assessment Tax Assessment Total Assessment is a certain percentage of the fair market value that is determined by local assessors to be the total taxable value of land and additions on the property. | Land | Improvement |
|---|---|---|---|---|
| 2025 | -- | $3,270 | $700 | $2,570 |
| 2024 | $177 | $3,270 | $700 | $2,570 |
| 2023 | $177 | $3,270 | $700 | $2,570 |
| 2022 | $176 | $3,250 | $700 | $2,550 |
| 2021 | $176 | $3,250 | $700 | $2,550 |
| 2020 | $176 | $3,250 | $700 | $2,550 |
| 2019 | $176 | $3,250 | $700 | $2,550 |
| 2018 | $176 | $3,250 | $700 | $2,550 |
| 2017 | $191 | $3,540 | $700 | $2,840 |
| 2016 | $177 | $3,540 | $700 | $2,840 |
| 2015 | $177 | $3,540 | $700 | $2,840 |
| 2014 | $177 | $3,540 | $700 | $2,840 |
Source: Public Records
Map
Nearby Homes