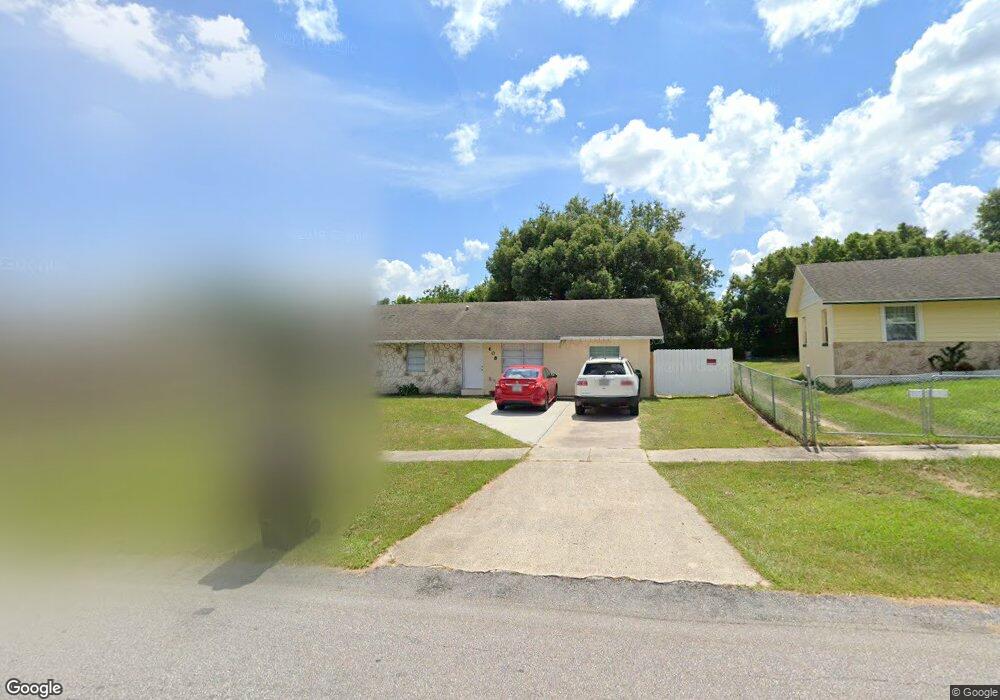
608 W Ella J Gilmore St Apopka, FL 32703
Estimated Value: $244,000 - $268,000
3
Beds
2
Baths
1,380
Sq Ft
$187/Sq Ft
Est. Value
About This Home
This home is located at 608 W Ella J Gilmore St, Apopka, FL 32703 and is currently estimated at $258,644, approximately $187 per square foot. 608 W Ella J Gilmore St is a home located in Orange County with nearby schools including Wheatley Elementary School, Wolf Lake Middle School, and Apopka High School.
Ownership History
Date
Name
Owned For
Owner Type
Purchase Details
Closed on
Dec 29, 2017
Sold by
Adalberto Jaramillo Llc
Bought by
Bolanos Robert and Bolanos Ramirez Ricardo
Current Estimated Value
Home Financials for this Owner
Home Financials are based on the most recent Mortgage that was taken out on this home.
Original Mortgage
$142,373
Outstanding Balance
$124,590
Interest Rate
5.5%
Mortgage Type
FHA
Estimated Equity
$134,054
Purchase Details
Closed on
Jan 25, 2017
Sold by
Tullus Properties Llc
Bought by
Adalberto Jaramillo Llc
Purchase Details
Closed on
Dec 20, 2016
Sold by
Christiana Trust
Bought by
Tullus Properties Llc
Purchase Details
Closed on
Dec 1, 2016
Bought by
Adalberto Jaramillo Llc
Purchase Details
Closed on
Apr 19, 2016
Sold by
Hatten Arcolia and Pringle Brian
Bought by
Christiana Trust
Purchase Details
Closed on
Mar 24, 2007
Sold by
Hatten Arcolia
Bought by
Pringle Brian
Create a Home Valuation Report for This Property
The Home Valuation Report is an in-depth analysis detailing your home's value as well as a comparison with similar homes in the area
Home Values in the Area
Average Home Value in this Area
Purchase History
| Date | Buyer | Sale Price | Title Company |
|---|---|---|---|
| Bolanos Robert | $145,000 | Stonebridge Title Group Llc | |
| Adalberto Jaramillo Llc | $40,000 | The Title Bridge Llc | |
| Tullus Properties Llc | $37,144 | Premium Title Services Inc | |
| Adalberto Jaramillo Llc | $37,200 | -- | |
| Christiana Trust | $50,200 | None Available | |
| Pringle Brian | $28,000 | None Available |
Source: Public Records
Mortgage History
| Date | Status | Borrower | Loan Amount |
|---|---|---|---|
| Open | Bolanos Robert | $142,373 |
Source: Public Records
Tax History Compared to Growth
Tax History
| Year | Tax Paid | Tax Assessment Tax Assessment Total Assessment is a certain percentage of the fair market value that is determined by local assessors to be the total taxable value of land and additions on the property. | Land | Improvement |
|---|---|---|---|---|
| 2025 | $3,370 | $195,120 | $75,000 | $120,120 |
| 2024 | $3,046 | $189,380 | $75,000 | $114,380 |
| 2023 | $3,046 | $182,882 | $75,000 | $107,882 |
| 2022 | $2,842 | $176,120 | $75,000 | $101,120 |
| 2021 | $2,477 | $133,655 | $45,000 | $88,655 |
| 2020 | $2,257 | $124,984 | $32,000 | $92,984 |
| 2019 | $2,377 | $125,706 | $32,000 | $93,706 |
| 2018 | $2,231 | $115,572 | $15,000 | $100,572 |
| 2017 | $906 | $35,143 | $15,000 | $20,143 |
| 2016 | $311 | $26,028 | $10,000 | $16,028 |
| 2015 | $479 | $25,424 | $10,000 | $15,424 |
| 2014 | $989 | $42,873 | $10,000 | $32,873 |
Source: Public Records
Map
Nearby Homes
- 414 W Ella J Gilmore St
- 400 W 13th St
- 875 Ocoee Apopka Rd
- 903 Pointe Emerson Blvd
- 714 Pointe Emerson Blvd
- 873 Pointe Emerson Blvd
- 413 Lady Palm St
- 804 Pointe Emerson Blvd
- 619 Pothos St
- 595 Pothos St
- 699 Pointe Emerson Blvd
- 575 Pothos St
- 469 Lady Palm St
- 497 Lady Palm St
- 607 Pothos St
- 583 Pothos St
- 827 Creeping Fig St
- 866 Creeping Fig St
- 342 Lady Palm St
- 346 Lady Palm St
- 602 W Ella J Gilmore St
- 614 W Ella J Gilmore St
- 544 W Ella J Gilmore St
- 620 W Ella J Gilmore St
- 609 W Ella J Gilmore St
- 615 W Ella J Gilmore St
- 603 W Ella J Gilmore St
- 538 W Ella J Gilmore St
- 626 W Ella J Gilmore St
- 543 W Ella J Gilmore St
- 621 W Ella J Gilmore St
- 532 W Ella J Gilmore St
- 627 W St
- 627 W Ella J Gilmore St
- 632 W Ella J Gilmore St
- 537 W Ella J Gilmore St
- 526 W Ella J Gilmore St
- 526 W 14th St
- 633 W Ella J Gilmore St
- 638 W Ella J Gilmore St