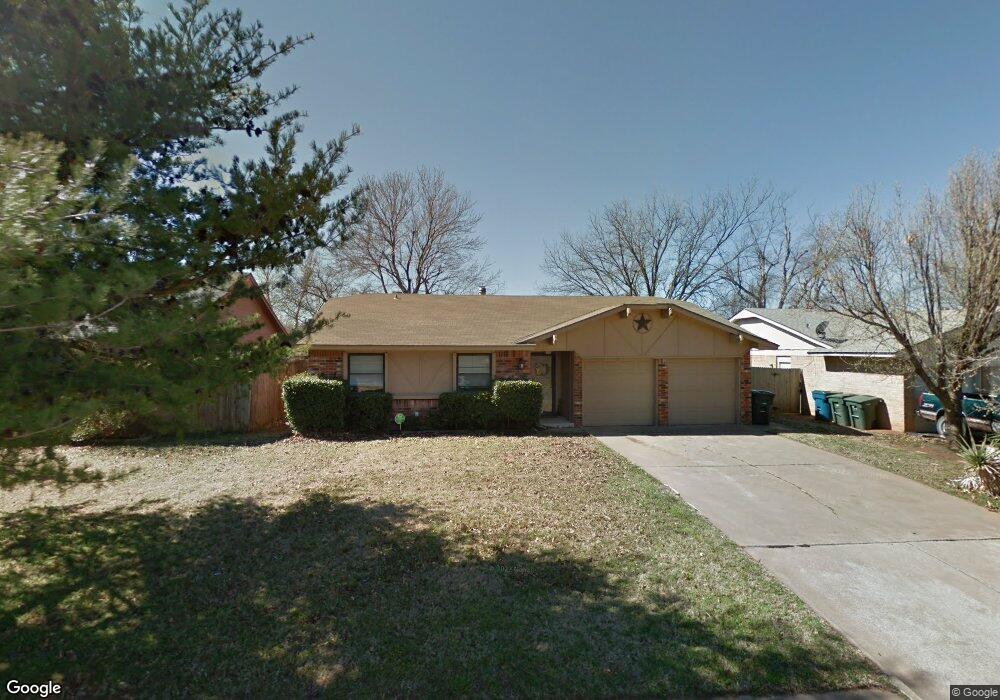
608 Wild Wind Rd Edmond, OK 73003
Meadow Lakes Park NeighborhoodEstimated Value: $200,000 - $217,907
3
Beds
2
Baths
1,226
Sq Ft
$170/Sq Ft
Est. Value
About This Home
This home is located at 608 Wild Wind Rd, Edmond, OK 73003 and is currently estimated at $208,227, approximately $169 per square foot. 608 Wild Wind Rd is a home located in Oklahoma County with nearby schools including Ida Freeman Elementary School, Cheyenne Middle School, and North High School.
Ownership History
Date
Name
Owned For
Owner Type
Purchase Details
Closed on
Sep 20, 2023
Sold by
Kaia Properties Llc
Bought by
Kash Monkey Llc
Current Estimated Value
Purchase Details
Closed on
Sep 19, 2023
Sold by
Kaia Properties Llc
Bought by
Kash Monkey Llc
Purchase Details
Closed on
Aug 17, 2020
Sold by
Cady Michael and Cady Kimberlee
Bought by
Kaia Properties Llc
Purchase Details
Closed on
Sep 10, 2012
Sold by
Bumey Brian R and Bumey Elizabeth Angela
Bought by
Cady Michael
Home Financials for this Owner
Home Financials are based on the most recent Mortgage that was taken out on this home.
Original Mortgage
$71,250
Interest Rate
3.59%
Mortgage Type
New Conventional
Purchase Details
Closed on
Nov 5, 2010
Sold by
Burney Brian R and Burney Elizabeth A
Bought by
Burney Brian R and Burney Elizabeth Angel
Purchase Details
Closed on
Mar 18, 2004
Sold by
Rao S Narasinga and Rao Shobha N
Bought by
Burney Brian R and Burney Elizabeth A
Create a Home Valuation Report for This Property
The Home Valuation Report is an in-depth analysis detailing your home's value as well as a comparison with similar homes in the area
Home Values in the Area
Average Home Value in this Area
Purchase History
| Date | Buyer | Sale Price | Title Company |
|---|---|---|---|
| Kash Monkey Llc | $215,000 | American Security Title | |
| Kash Monkey Llc | $215,000 | American Security Title | |
| Kaia Properties Llc | -- | None Available | |
| Cady Michael | $95,000 | The Oklahoma City Abst & Tit | |
| Burney Brian R | -- | None Available | |
| Burney Brian R | $89,000 | Stewart Abstract & Title Of |
Source: Public Records
Mortgage History
| Date | Status | Borrower | Loan Amount |
|---|---|---|---|
| Previous Owner | Cady Michael | $71,250 |
Source: Public Records
Tax History Compared to Growth
Tax History
| Year | Tax Paid | Tax Assessment Tax Assessment Total Assessment is a certain percentage of the fair market value that is determined by local assessors to be the total taxable value of land and additions on the property. | Land | Improvement |
|---|---|---|---|---|
| 2024 | $1,628 | $20,570 | $2,838 | $17,732 |
| 2023 | $1,628 | $15,616 | $2,283 | $13,333 |
| 2022 | $1,556 | $14,873 | $2,460 | $12,413 |
| 2021 | $1,475 | $14,165 | $2,658 | $11,507 |
| 2020 | $1,422 | $13,491 | $2,111 | $11,380 |
| 2019 | $1,361 | $12,848 | $2,051 | $10,797 |
| 2018 | $1,304 | $12,237 | $0 | $0 |
| 2017 | $1,236 | $11,653 | $1,963 | $9,690 |
| 2016 | $1,175 | $11,098 | $1,752 | $9,346 |
| 2015 | $1,117 | $10,570 | $2,006 | $8,564 |
| 2014 | $1,116 | $10,570 | $2,006 | $8,564 |
Source: Public Records
Map
Nearby Homes
- 711 Hawthorne Ln
- 705 Holly Hill Rd
- 1224 Capitol Dr
- 712 Willow Ridge Place
- 402 Lanes Turn
- 1101 Teal Place
- 1113 Swan Lake Rd
- 308 Clermont Dr
- 1217 Sequoyah Place Unit C
- 1225 Sequoyah Place Unit D
- 805 Mallard Ave
- 152 Barrett Place
- 1617 Apian Way
- 1212 Sequoyah Place Unit C
- 728 Teal Place
- 432 Wisdom Way
- 300 N Fretz Ave
- 105 Ashley Dr
- 733 Lapwing Rd
- 1100 Pruett Dr
- 604 Wild Wind Rd
- 612 Wild Wind Rd
- 530 Wild Wind Rd
- 609 Hawthorne Place
- 613 Hawthorne Place
- 600 Wild Wind Rd
- 605 Hawthorne Place
- 616 Wild Wind Rd
- 528 Wild Wind Rd
- 617 Hawthorne Place
- 529 Holly Hill Rd
- 601 Hawthorne Place
- 621 Hawthorne Place
- 620 Wild Wind Rd
- 524 Wild Wind Rd
- 539 Wild Wind Rd
- 525 Holly Hill Rd
- 625 Hawthorne Place Unit 4055093748
- 533 Wild Wind Rd
- 700 Red Oak Terrace