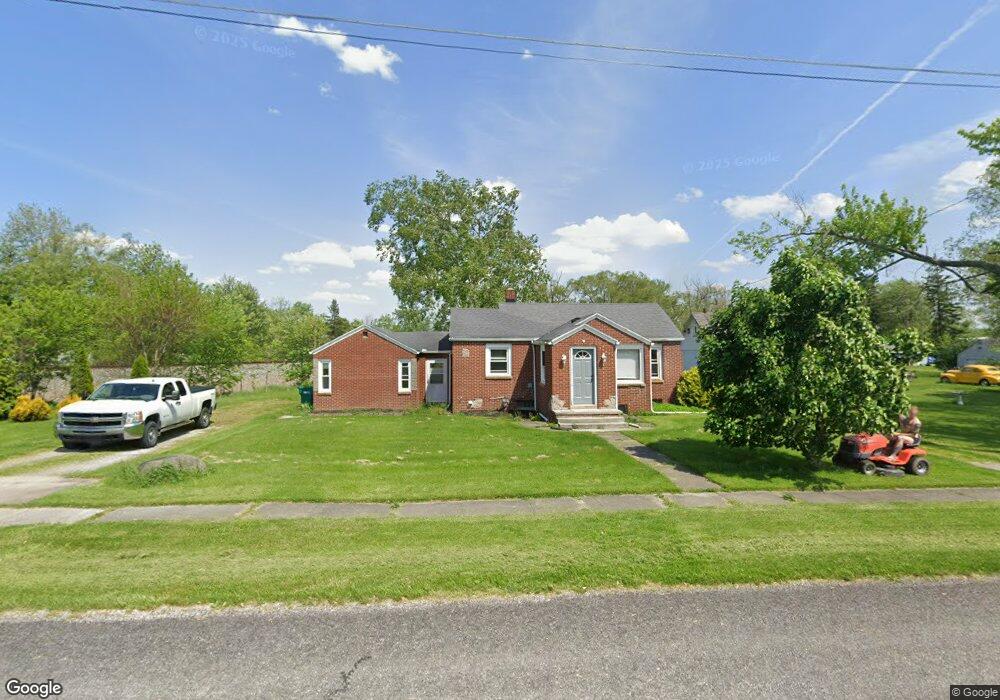
6081 N Martin Williston Rd Curtice, OH 43412
Estimated Value: $177,858 - $210,000
3
Beds
2
Baths
1,322
Sq Ft
$147/Sq Ft
Est. Value
About This Home
This home is located at 6081 N Martin Williston Rd, Curtice, OH 43412 and is currently estimated at $194,215, approximately $146 per square foot. 6081 N Martin Williston Rd is a home located in Ottawa County with nearby schools including Genoa Elementary School.
Ownership History
Date
Name
Owned For
Owner Type
Purchase Details
Closed on
Aug 10, 2018
Sold by
Koester Kevin and Koester Jennifer L
Bought by
Besgrove Mark
Current Estimated Value
Home Financials for this Owner
Home Financials are based on the most recent Mortgage that was taken out on this home.
Original Mortgage
$84,000
Outstanding Balance
$72,951
Interest Rate
4.5%
Mortgage Type
New Conventional
Estimated Equity
$121,264
Purchase Details
Closed on
Jan 26, 2011
Sold by
Oleszczuk Barbara K and Oleszczuk Daniel V
Bought by
Koester Kevin and Koester Jennifer L
Home Financials for this Owner
Home Financials are based on the most recent Mortgage that was taken out on this home.
Original Mortgage
$72,390
Interest Rate
4.82%
Mortgage Type
New Conventional
Purchase Details
Closed on
Mar 17, 2004
Sold by
Estate Of Beatrice S Sutter
Bought by
Oleszczuk Barbara K
Create a Home Valuation Report for This Property
The Home Valuation Report is an in-depth analysis detailing your home's value as well as a comparison with similar homes in the area
Home Values in the Area
Average Home Value in this Area
Purchase History
| Date | Buyer | Sale Price | Title Company |
|---|---|---|---|
| Besgrove Mark | $94,000 | None Available | |
| Koester Kevin | $76,200 | Attorney | |
| Oleszczuk Barbara K | -- | -- |
Source: Public Records
Mortgage History
| Date | Status | Borrower | Loan Amount |
|---|---|---|---|
| Open | Besgrove Mark | $84,000 | |
| Previous Owner | Koester Kevin | $72,390 |
Source: Public Records
Tax History Compared to Growth
Tax History
| Year | Tax Paid | Tax Assessment Tax Assessment Total Assessment is a certain percentage of the fair market value that is determined by local assessors to be the total taxable value of land and additions on the property. | Land | Improvement |
|---|---|---|---|---|
| 2024 | $2,167 | $48,234 | $12,128 | $36,106 |
| 2023 | $2,167 | $37,636 | $9,331 | $28,305 |
| 2022 | $1,918 | $37,636 | $9,331 | $28,305 |
| 2021 | $1,697 | $37,640 | $9,330 | $28,310 |
| 2020 | $1,640 | $34,490 | $7,780 | $26,710 |
| 2019 | $1,631 | $34,490 | $7,780 | $26,710 |
| 2018 | $1,572 | $34,490 | $7,780 | $26,710 |
| 2017 | $1,404 | $29,040 | $7,780 | $21,260 |
| 2016 | $1,414 | $29,040 | $7,780 | $21,260 |
| 2015 | $1,423 | $29,040 | $7,780 | $21,260 |
| 2014 | $737 | $32,540 | $7,780 | $24,760 |
| 2013 | $1,479 | $32,540 | $7,780 | $24,760 |
Source: Public Records
Map
Nearby Homes
- 21224 W Toledo St
- 0 W Walbridge Rd
- Track 1 W Walbridge Rd
- 19367 W Walbridge Rd
- 6927 N Wildacre Rd
- 7330 Jerusalem Rd
- 445 S Yondota Rd
- 7105 N Elliston Trowbridge Rd
- 24181 W James Ridge Rd
- 9015 Seaman Rd
- 725 Donovan Rd
- 6645 Seaman Rd
- 1861 N Opfer-Lentz Rd
- 23105 W Edgefield Dr
- 5300 Williston Rd
- 5401 Pickle Rd
- 23225 Ohio 51
- 23430 State Route 51 W
- 1031 N Cousino Rd
- 1615 N Thyre Dr
- 6081 Martin Williston Rd
- 20965 W Toledo St
- 6045 N Martin Williston Rd
- 6054 N Martin Williston Rd
- 6070 N Martin Williston Rd
- 6080 N Martin Williston Rd
- 6070 N Martin Williston Rd
- 20975 W Toledo St
- 20987 W Toledo St
- 6137 N Martin Williston Rd
- 20955 N Toledo
- 20938 Thorpe St
- 20935 W Toledo St
- 6161 N Martin Williston Rd
- 6080 N Martin Williston Rd
- 6161 N Martin Williston Rd
- 21041 W Toledo St
- 0 Sr 579 Unit 905894
- 0 Sr 579 Unit 905893
- 0 Sr 579 Unit 905895