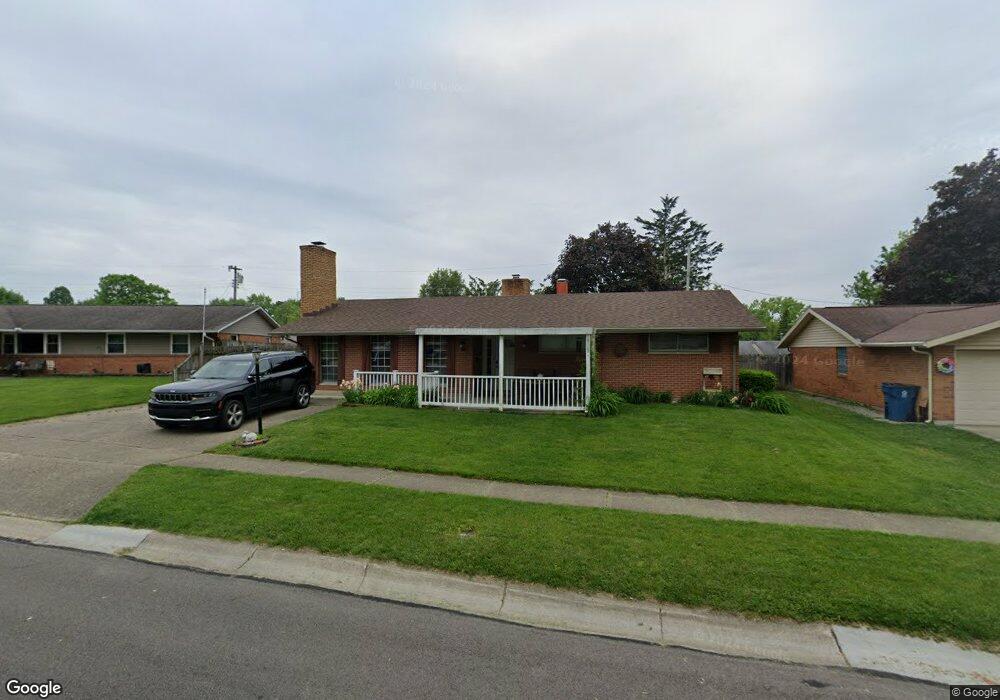
6083 Turnbridge Ln Dayton, OH 45424
Estimated Value: $156,000 - $232,000
3
Beds
2
Baths
1,782
Sq Ft
$118/Sq Ft
Est. Value
About This Home
This home is located at 6083 Turnbridge Ln, Dayton, OH 45424 and is currently estimated at $210,050, approximately $117 per square foot. 6083 Turnbridge Ln is a home located in Montgomery County with nearby schools including Wayne High School and Huber Heights Christian Academy.
Ownership History
Date
Name
Owned For
Owner Type
Purchase Details
Closed on
Jun 19, 2018
Sold by
Clemens Michael
Bought by
Clemens Jodie
Current Estimated Value
Purchase Details
Closed on
Oct 12, 2016
Sold by
Clemens Mark T and Clemens Rhonda A
Bought by
Clemens Jodie L and Clemens Michael
Home Financials for this Owner
Home Financials are based on the most recent Mortgage that was taken out on this home.
Original Mortgage
$76,000
Outstanding Balance
$60,928
Interest Rate
3.46%
Mortgage Type
New Conventional
Estimated Equity
$149,122
Purchase Details
Closed on
Nov 20, 2014
Sold by
Lentsch Edith M
Bought by
Clemens Mark T and Clemens Rhonda A
Home Financials for this Owner
Home Financials are based on the most recent Mortgage that was taken out on this home.
Original Mortgage
$75,000
Interest Rate
3.97%
Mortgage Type
Future Advance Clause Open End Mortgage
Create a Home Valuation Report for This Property
The Home Valuation Report is an in-depth analysis detailing your home's value as well as a comparison with similar homes in the area
Home Values in the Area
Average Home Value in this Area
Purchase History
| Date | Buyer | Sale Price | Title Company |
|---|---|---|---|
| Clemens Jodie | -- | None Available | |
| Clemens Jodie L | $95,000 | Home Services Title Llc | |
| Clemens Mark T | $93,800 | Land Title North Llc |
Source: Public Records
Mortgage History
| Date | Status | Borrower | Loan Amount |
|---|---|---|---|
| Open | Clemens Jodie L | $76,000 | |
| Previous Owner | Clemens Mark T | $75,000 |
Source: Public Records
Tax History Compared to Growth
Tax History
| Year | Tax Paid | Tax Assessment Tax Assessment Total Assessment is a certain percentage of the fair market value that is determined by local assessors to be the total taxable value of land and additions on the property. | Land | Improvement |
|---|---|---|---|---|
| 2024 | $2,909 | $56,530 | $10,010 | $46,520 |
| 2023 | $2,909 | $56,530 | $10,010 | $46,520 |
| 2022 | $2,581 | $39,500 | $7,000 | $32,500 |
| 2021 | $2,615 | $39,500 | $7,000 | $32,500 |
| 2020 | $2,617 | $39,500 | $7,000 | $32,500 |
| 2019 | $2,421 | $32,280 | $7,000 | $25,280 |
| 2018 | $2,430 | $32,280 | $7,000 | $25,280 |
| 2017 | $2,413 | $32,280 | $7,000 | $25,280 |
| 2016 | $2,283 | $29,750 | $7,000 | $22,750 |
| 2015 | $2,254 | $29,750 | $7,000 | $22,750 |
| 2014 | $2,254 | $29,750 | $7,000 | $22,750 |
| 2012 | -- | $32,940 | $8,750 | $24,190 |
Source: Public Records
Map
Nearby Homes
- 5080 Tilbury Rd
- 5135 Chesham Dr
- 5248 Tilbury Rd
- 5893 Tomberg St
- 5004 Fishburg Rd
- 5848 Tomberg St
- 5983 Harshmanville Rd
- 4944 Chesham Dr
- 5159 Fishburg Rd
- 5952 Tibet Dr
- 5784 Pennywell Dr
- 6246 Old Troy Pike
- 6529 Harshmanville Rd
- 6100 Farmborough Dr
- 4955 Pennswood Dr
- 5625 Copley Cir
- 5455 Flotron Dr
- 5669 Traymore Dr
- 5488 Flotron Dr
- 5660 Tomberg St
- 6091 Turnbridge Ln
- 6075 Turnbridge Ln
- 6072 Tomberg St
- 6064 Tomberg St
- 6080 Tomberg St
- 5132 Tilbury Rd
- 6066 Turnbridge Ln
- 6067 Turnbridge Ln
- 6056 Tomberg St
- 5113 Tilbury Rd
- 5121 Tilbury Rd
- 6048 Tomberg St
- 6059 Turnbridge Ln
- 5140 Tilbury Rd
- 6048 Turnbridge Ln
- 5105 Tilbury Rd
- 5129 Tilbury Rd
- 5085 Tewkesbury Dr
- 5098 Tilbury Rd
- 6051 Turnbridge Ln