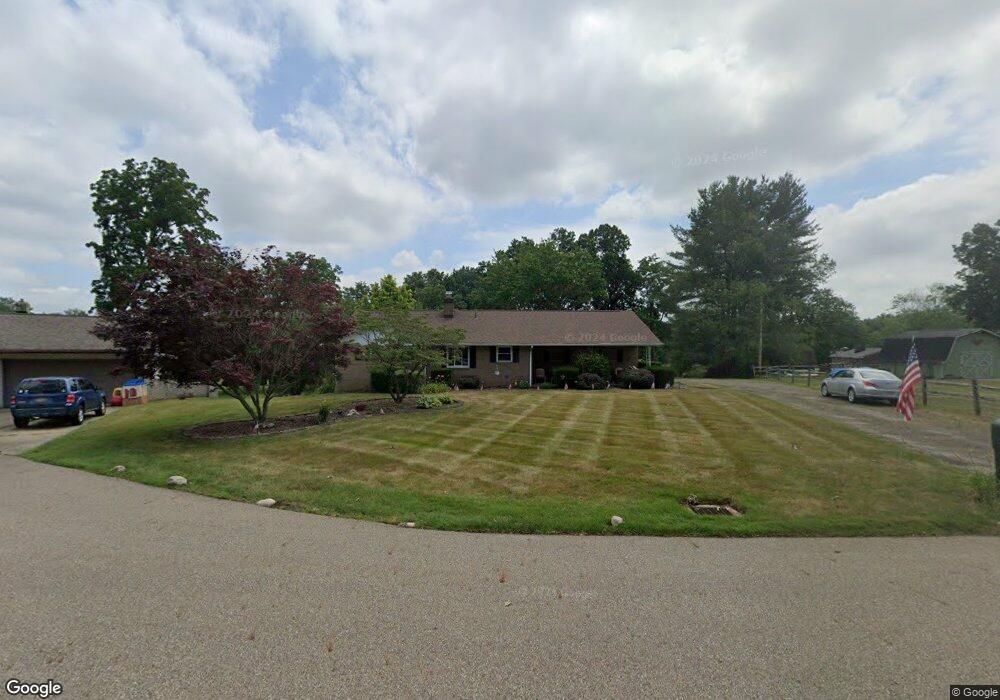
6084 Leyton Ave NE Canton, OH 44721
Estimated Value: $205,000 - $255,000
2
Beds
2
Baths
1,192
Sq Ft
$194/Sq Ft
Est. Value
About This Home
This home is located at 6084 Leyton Ave NE, Canton, OH 44721 and is currently estimated at $230,970, approximately $193 per square foot. 6084 Leyton Ave NE is a home located in Stark County with nearby schools including Charles L. Warstler Elementary School, Oakwood Middle School, and GlenOak High School.
Ownership History
Date
Name
Owned For
Owner Type
Purchase Details
Closed on
Nov 25, 2020
Sold by
Vanderground Thomas Charles and Vanderground Elaine Marie
Bought by
Vanderground Thomas Charles and Vandcrground Elaine Marie
Current Estimated Value
Home Financials for this Owner
Home Financials are based on the most recent Mortgage that was taken out on this home.
Original Mortgage
$120,800
Interest Rate
3.1%
Mortgage Type
New Conventional
Purchase Details
Closed on
Sep 6, 2005
Sold by
Vanderground Thomas Charles and Vanderground Elaine Marie
Bought by
Vanderground Thomas Charles and Vanderground Elaine Marie
Purchase Details
Closed on
Jan 5, 1999
Sold by
Anderson Alvin L and Anderson Lucy M
Bought by
Vanderground Thomas C and Vanderground Elaine M
Home Financials for this Owner
Home Financials are based on the most recent Mortgage that was taken out on this home.
Original Mortgage
$76,000
Interest Rate
6.83%
Mortgage Type
Purchase Money Mortgage
Create a Home Valuation Report for This Property
The Home Valuation Report is an in-depth analysis detailing your home's value as well as a comparison with similar homes in the area
Home Values in the Area
Average Home Value in this Area
Purchase History
| Date | Buyer | Sale Price | Title Company |
|---|---|---|---|
| Vanderground Thomas Charles | -- | Amrock Inc | |
| Vanderground Thomas Charles | -- | Amrock Inc | |
| Vanderground Thomas Charles | -- | -- | |
| Vanderground Thomas C | $92,000 | Supreme Title Agency Ltd |
Source: Public Records
Mortgage History
| Date | Status | Borrower | Loan Amount |
|---|---|---|---|
| Closed | Vanderground Thomas Charles | $120,800 | |
| Closed | Vanderground Thomas C | $76,000 |
Source: Public Records
Tax History Compared to Growth
Tax History
| Year | Tax Paid | Tax Assessment Tax Assessment Total Assessment is a certain percentage of the fair market value that is determined by local assessors to be the total taxable value of land and additions on the property. | Land | Improvement |
|---|---|---|---|---|
| 2025 | -- | $70,010 | $24,890 | $45,120 |
| 2024 | -- | $70,010 | $24,890 | $45,120 |
| 2023 | $2,463 | $52,860 | $16,490 | $36,370 |
| 2022 | $2,475 | $52,860 | $16,490 | $36,370 |
| 2021 | $2,486 | $52,860 | $16,490 | $36,370 |
| 2020 | $2,487 | $48,130 | $14,210 | $33,920 |
| 2019 | $2,466 | $48,140 | $14,220 | $33,920 |
| 2018 | $2,436 | $48,140 | $14,220 | $33,920 |
| 2017 | $2,345 | $42,540 | $12,960 | $29,580 |
| 2016 | $2,042 | $36,940 | $12,960 | $23,980 |
| 2015 | $1,974 | $36,940 | $12,960 | $23,980 |
| 2014 | $1,913 | $35,010 | $12,290 | $22,720 |
| 2013 | $934 | $35,010 | $12,290 | $22,720 |
Source: Public Records
Map
Nearby Homes
- 2550 Chaucer Dr NE
- 5907 Wiclif Rd NE
- 6402 Blossomwood Cir NE
- 6428 Blossomwood Cir NE
- 2511 58th St NE
- 6110 Glessner Ave NE
- 2690 Crompton St NE
- 5700 Birmingham Rd NE
- 6010 Firestone Rd NE
- 6666 Carriage Lane Ave NE
- 5409 Glenhill Ave NE
- 5242 Aster Ave NE
- 6654 Windgate Ave NE
- 2218 Hiddenbrook St NE
- 6960 Middlebranch Ave NE
- 2040 55th St NE
- 6456 Horseshoe Ave NE
- 3240 Eastern St NE
- 6914 Stonecreek Ave NE
- 2044 Longfellow St NE
- 6100 Leyton Ave NE
- 6050 Leyton Ave NE
- 2663 Chaucer Dr NE
- 6055 Wiclif St NE
- 2685 Chaucer Dr NE
- 6101 Leyton Ave NE
- 2625 Chaucer Dr NE
- 6085 Leyton Ave NE
- 2705 Chaucer Dr NE
- 6061 Wiclif St NE
- 2601 Chaucer Dr NE
- 2660 Chaucer Dr NE
- 2650 Chaucer Dr NE
- 6075 Wiclif St NE
- 2690 Chaucer Dr NE
- 2620 Chaucer Dr NE
- 2735 Chaucer Dr NE
- 2708 Mcdowell St NE
- 2575 Chaucer Dr NE
- 6060 Wiclif St NE