Estimated Value: $390,209 - $432,000
4
Beds
2
Baths
2,122
Sq Ft
$194/Sq Ft
Est. Value
About This Home
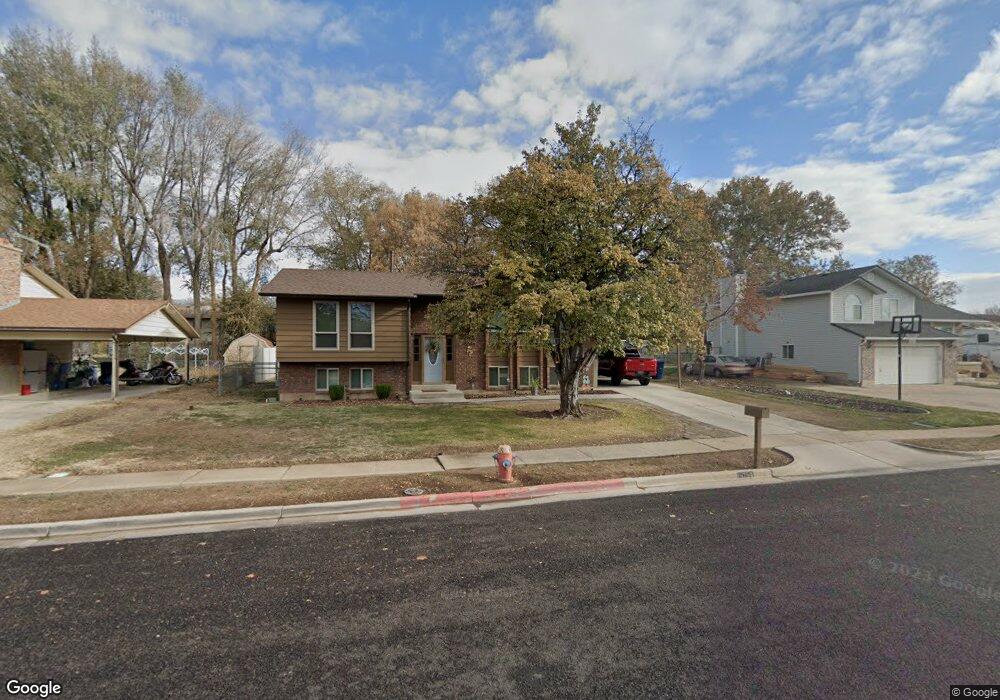
This home is located at 6084 S 2850 W, Roy, UT 84067 and is currently estimated at $411,802, approximately $194 per square foot. 6084 S 2850 W is a home located in Weber County with nearby schools including Roy Elementary School, Roy Junior High School, and Roy High School.
Ownership History
Date
Name
Owned For
Owner Type
Purchase Details
Closed on
Jun 30, 2021
Sold by
Jaramillo Ronnie C
Bought by
Jaramillo Ronnie C and Jaramillo Tammy
Current Estimated Value
Home Financials for this Owner
Home Financials are based on the most recent Mortgage that was taken out on this home.
Original Mortgage
$146,000
Outstanding Balance
$132,472
Interest Rate
2.9%
Mortgage Type
New Conventional
Estimated Equity
$279,330
Purchase Details
Closed on
Aug 27, 1998
Sold by
Beard Barbara and Beard Barbara Falcon
Bought by
Jaramillo Ronnie C
Home Financials for this Owner
Home Financials are based on the most recent Mortgage that was taken out on this home.
Original Mortgage
$105,368
Interest Rate
6.91%
Mortgage Type
FHA
Purchase Details
Closed on
May 1, 1997
Sold by
Nilson & Company Inc
Bought by
Beard Barbara F
Home Financials for this Owner
Home Financials are based on the most recent Mortgage that was taken out on this home.
Original Mortgage
$158,300
Interest Rate
8.08%
Create a Home Valuation Report for This Property
The Home Valuation Report is an in-depth analysis detailing your home's value as well as a comparison with similar homes in the area
Home Values in the Area
Average Home Value in this Area
Purchase History
| Date | Buyer | Sale Price | Title Company |
|---|---|---|---|
| Jaramillo Ronnie C | -- | Backman Title Services | |
| Jaramillo Ronnie C | -- | U S Title | |
| Beard Barbara F | -- | Bonneville Title |
Source: Public Records
Mortgage History
| Date | Status | Borrower | Loan Amount |
|---|---|---|---|
| Open | Jaramillo Ronnie C | $146,000 | |
| Closed | Jaramillo Ronnie C | $105,368 | |
| Previous Owner | Beard Barbara F | $158,300 |
Source: Public Records
Tax History Compared to Growth
Tax History
| Year | Tax Paid | Tax Assessment Tax Assessment Total Assessment is a certain percentage of the fair market value that is determined by local assessors to be the total taxable value of land and additions on the property. | Land | Improvement |
|---|---|---|---|---|
| 2025 | $2,620 | $415,402 | $120,026 | $295,376 |
| 2024 | $2,409 | $210,099 | $66,014 | $144,085 |
| 2023 | $2,239 | $194,700 | $65,864 | $128,836 |
| 2022 | $2,363 | $212,850 | $57,758 | $155,092 |
| 2021 | $1,925 | $284,000 | $75,002 | $208,998 |
| 2020 | $1,841 | $250,000 | $75,002 | $174,998 |
| 2019 | $1,743 | $222,000 | $44,976 | $177,024 |
| 2018 | $1,618 | $193,000 | $40,002 | $152,998 |
| 2017 | $1,572 | $176,000 | $37,050 | $138,950 |
| 2016 | $1,421 | $84,657 | $16,499 | $68,158 |
| 2015 | $1,264 | $76,315 | $16,499 | $59,816 |
| 2014 | $1,274 | $76,315 | $16,499 | $59,816 |
Source: Public Records
Map
Nearby Homes
- 2537 N 1220 W
- 2509 N 1170 W
- 2829 W 5925 S
- 3009 W 6000 S
- 5998 S 3100 W
- 2907 W 5775 S
- 2672 W 5750 S
- 2382 N 770 W
- 2587 W 5750 S
- 2571 W 5725 S
- 2486 N 690 W
- 5810 S 2550 W
- 2612 N 525 W
- 2635 N 500 W Unit 45
- 2646 W 5625 S Unit M-2646
- 484 W 2650 N
- 480 W 2650 N
- 5791 S 3260 W
- 2512 N 475 W
- 2778 W 5550 S Unit 28