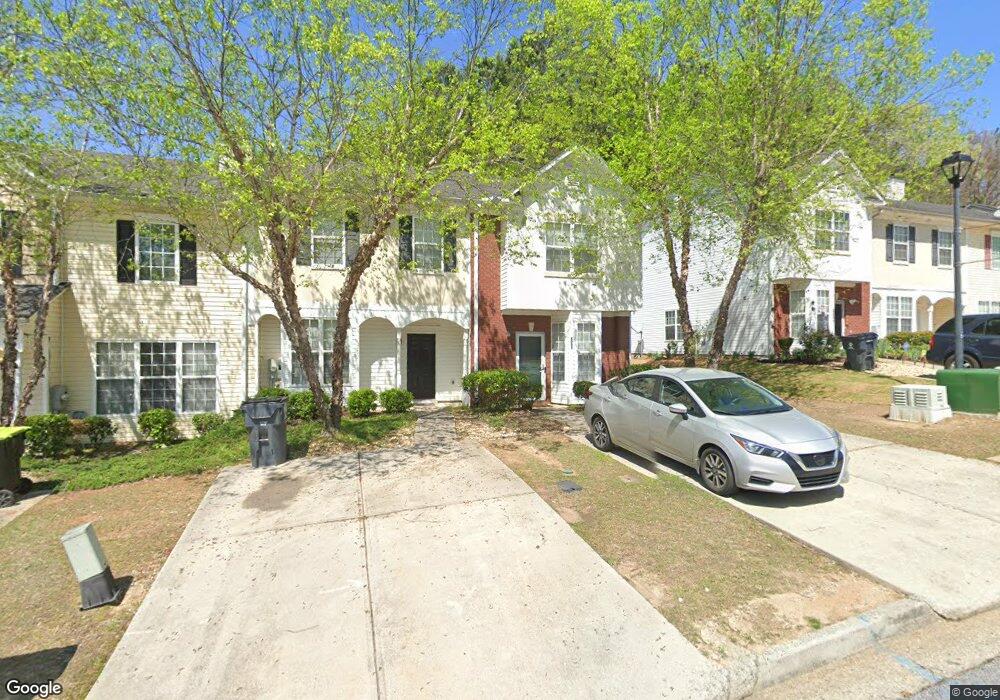
6085 Camden Forrest Dr Riverdale, GA 30296
Estimated Value: $133,000 - $192,000
3
Beds
3
Baths
892
Sq Ft
$194/Sq Ft
Est. Value
About This Home
This home is located at 6085 Camden Forrest Dr, Riverdale, GA 30296 and is currently estimated at $172,619, approximately $193 per square foot. 6085 Camden Forrest Dr is a home located in Clayton County with nearby schools including Oliver Elementary School, North Clayton Middle School, and North Clayton High School.
Ownership History
Date
Name
Owned For
Owner Type
Purchase Details
Closed on
Oct 18, 2021
Sold by
Bartholomew Richard
Bought by
Lavigne Donnisha Marie and Johnson Donna Marie
Current Estimated Value
Purchase Details
Closed on
Jun 30, 2008
Sold by
Hud-Housing Of Urban Dev
Bought by
Bartholomew Richard
Home Financials for this Owner
Home Financials are based on the most recent Mortgage that was taken out on this home.
Original Mortgage
$45,900
Interest Rate
5.96%
Mortgage Type
New Conventional
Purchase Details
Closed on
Nov 6, 2007
Sold by
Dowens Thomas O
Bought by
Everhome Mortgage Co
Purchase Details
Closed on
Mar 31, 2004
Sold by
Forrest Homes Inc
Bought by
Dowens Thomas O
Home Financials for this Owner
Home Financials are based on the most recent Mortgage that was taken out on this home.
Original Mortgage
$99,733
Interest Rate
5.54%
Mortgage Type
VA
Purchase Details
Closed on
Jun 12, 2003
Sold by
Cypress Dev/Realty Of Ga Inc
Bought by
Forrest Homes Inc
Create a Home Valuation Report for This Property
The Home Valuation Report is an in-depth analysis detailing your home's value as well as a comparison with similar homes in the area
Home Values in the Area
Average Home Value in this Area
Purchase History
| Date | Buyer | Sale Price | Title Company |
|---|---|---|---|
| Lavigne Donnisha Marie | -- | -- | |
| Bartholomew Richard | -- | -- | |
| Everhome Mortgage Co | -- | -- | |
| Dowens Thomas O | $108,000 | -- | |
| Forrest Homes Inc | $160,000 | -- |
Source: Public Records
Mortgage History
| Date | Status | Borrower | Loan Amount |
|---|---|---|---|
| Previous Owner | Bartholomew Richard | $45,900 | |
| Previous Owner | Dowens Thomas O | $99,733 |
Source: Public Records
Tax History Compared to Growth
Tax History
| Year | Tax Paid | Tax Assessment Tax Assessment Total Assessment is a certain percentage of the fair market value that is determined by local assessors to be the total taxable value of land and additions on the property. | Land | Improvement |
|---|---|---|---|---|
| 2024 | $2,335 | $58,880 | $5,600 | $53,280 |
| 2023 | $2,088 | $57,840 | $5,600 | $52,240 |
| 2022 | $1,752 | $43,680 | $5,600 | $38,080 |
| 2021 | $1,482 | $36,560 | $5,600 | $30,960 |
| 2020 | $1,265 | $30,688 | $5,600 | $25,088 |
| 2019 | $1,027 | $24,351 | $4,800 | $19,551 |
| 2018 | $918 | $21,686 | $4,800 | $16,886 |
| 2017 | $761 | $17,758 | $4,800 | $12,958 |
| 2016 | $819 | $19,198 | $4,800 | $14,398 |
| 2015 | $742 | $0 | $0 | $0 |
| 2014 | $735 | $17,523 | $5,600 | $11,923 |
Source: Public Records
Map
Nearby Homes
- 6099 Camden Forrest Dr
- 6073 Camden Forrest Dr
- 6076 Camden Forrest Dr
- 1695 Camden Forrest Trail
- 6105 Camden Forrest Ct
- 6080 Camden Forrest Cove
- 1791 Flat Shoals Rd
- 1711 Austin Dr
- 6105 E Fayetteville Dr
- 6181 E Fayetteville Dr
- 6207 Willowbrook Dr
- 0 Cater Ln Unit 10461792
- 0 Cater Ln Unit 7526768
- 5967 Yellowood Ct
- 5937 Yellowood Ct
- 1836 Whitworth Dr
- 1593 Willow Wood Trace
- 6253 E Fayetteville Dr
- 1618 Blossom Dr
- 6087 Camden Forrest Dr
- 6089 Camden Forrest Dr
- 6091 Camden Forrest Dr
- 6081 Camden Forrest Dr
- 6093 Camden Forrest Dr
- 6079 Camden Forrest Dr
- 6095 Camden Forrest Dr
- 6077 Camden Forrest Dr
- 1735 Camden Forrest Trail
- 6097 Camden Forrest Dr
- 1737 Camden Forrest Trail
- 6075 Camden Forrest Dr
- 1739 Camden Forrest Trail
- 1741 Camden Forrest Trail
- 6086 Camden Forrest Dr
- 6084 Camden Forrest Dr
- 6088 Camden Forrest Dr
- 6071 Camden Forrest Dr Unit 8
- 6071 Camden Forrest Dr
- 6090 Camden Forrest Dr