Estimated Value: $248,820 - $276,000
3
Beds
2
Baths
1,591
Sq Ft
$165/Sq Ft
Est. Value
About This Home
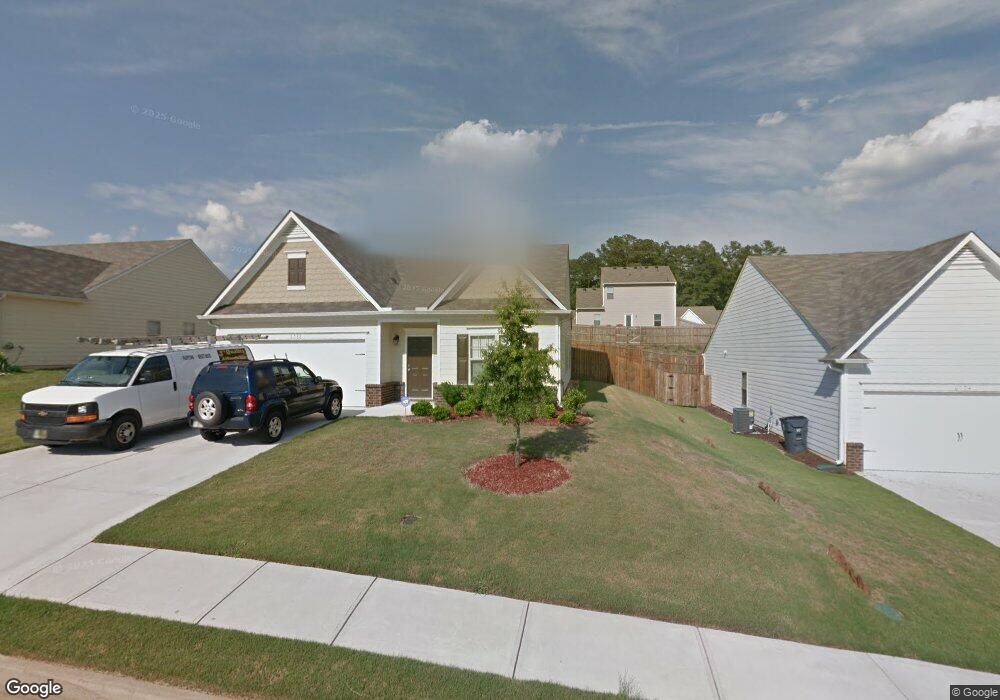
This home is located at 6088 Semaphore Ridge, Rex, GA 30273 and is currently estimated at $262,410, approximately $164 per square foot. 6088 Semaphore Ridge is a home with nearby schools including Roberta T. Smith Elementary School, Adamson Middle School, and Morrow High School.
Ownership History
Date
Name
Owned For
Owner Type
Purchase Details
Closed on
Sep 4, 2019
Sold by
Branch James Calvin
Bought by
Branch James Calvin and Branch Celeste Verlaine
Current Estimated Value
Home Financials for this Owner
Home Financials are based on the most recent Mortgage that was taken out on this home.
Original Mortgage
$160,000
Outstanding Balance
$123,399
Interest Rate
3.6%
Mortgage Type
VA
Estimated Equity
$139,011
Purchase Details
Closed on
Jun 27, 2014
Sold by
Lgi Homes Georgia Llc
Bought by
Branch James Calvin
Home Financials for this Owner
Home Financials are based on the most recent Mortgage that was taken out on this home.
Original Mortgage
$137,900
Interest Rate
4.19%
Mortgage Type
VA
Purchase Details
Closed on
Sep 27, 2013
Sold by
Bank Of Atlanta
Bought by
Lgi Homes Georgia Llc
Create a Home Valuation Report for This Property
The Home Valuation Report is an in-depth analysis detailing your home's value as well as a comparison with similar homes in the area
Home Values in the Area
Average Home Value in this Area
Purchase History
| Date | Buyer | Sale Price | Title Company |
|---|---|---|---|
| Branch James Calvin | -- | -- | |
| Branch James Calvin | $137,900 | -- | |
| Lgi Homes Georgia Llc | $725,000 | -- |
Source: Public Records
Mortgage History
| Date | Status | Borrower | Loan Amount |
|---|---|---|---|
| Open | Branch James Calvin | $160,000 | |
| Previous Owner | Branch James Calvin | $137,900 |
Source: Public Records
Tax History Compared to Growth
Tax History
| Year | Tax Paid | Tax Assessment Tax Assessment Total Assessment is a certain percentage of the fair market value that is determined by local assessors to be the total taxable value of land and additions on the property. | Land | Improvement |
|---|---|---|---|---|
| 2024 | $38 | $112,000 | $9,600 | $102,400 |
| 2023 | $4,222 | $116,920 | $9,600 | $107,320 |
| 2022 | $3,611 | $91,040 | $9,600 | $81,440 |
| 2021 | $2,724 | $68,000 | $9,600 | $58,400 |
| 2020 | $2,763 | $68,131 | $9,600 | $58,531 |
| 2019 | $2,600 | $63,102 | $8,400 | $54,702 |
| 2018 | $2,569 | $62,351 | $8,400 | $53,951 |
| 2017 | $2,583 | $62,547 | $8,400 | $54,147 |
| 2016 | $2,503 | $60,578 | $8,400 | $52,178 |
| 2015 | $2,245 | $0 | $0 | $0 |
| 2014 | $137 | $2,478 | $2,478 | $0 |
Source: Public Records
Map
Nearby Homes
- 5904 Foxfield Trail
- 6324 Amberly Rd
- 5847 Pinetree Ln
- 68 Pine Dr
- 110 Stagecoach Trail
- 3874 Rex Cir
- 3709 Charlotte Dr
- 3821 Rex Mill Square
- 6435 Cumberland Dr
- 3694 Rex Rd
- 3645 Fay Dr Unit 1
- 6057 Dorchester Dr
- 5861 Colonnade Dr
- 6103 Chaseland Rd
- 6103 Chaseland Dr
- 6495 Old MacOn Hwy
- 6683 Homestead Rd
- 6139 Katherine Rd
- 6010 Crooked Creek Dr
- 6082 Semaphore Ridge
- 6094 Semaphore Ridge
- 6067 Heisler St Unit 79
- 6061 Heisler St Unit 80
- 6061 Heisler St
- 6076 Semaphore Ridge
- 6055 Heisler St Unit 81
- 6055 Heisler St
- 6073 Heisler St Unit 78
- 6073 Heisler St
- 6087 Semaphore Ridge
- 6093 Semaphore Ridge Unit 54
- 6093 Semaphore Ridge
- 6081 Semaphore Ridge Unit 56
- 6081 Semaphore Ridge
- 0 Semaphore Ridge Unit 8350639
- 0 Semaphore Ridge Unit 8333205
- 0 Semaphore Ridge Unit 8149841
- 0 Semaphore Ridge Unit 9002998
- 0 Semaphore Ridge Unit 8862143