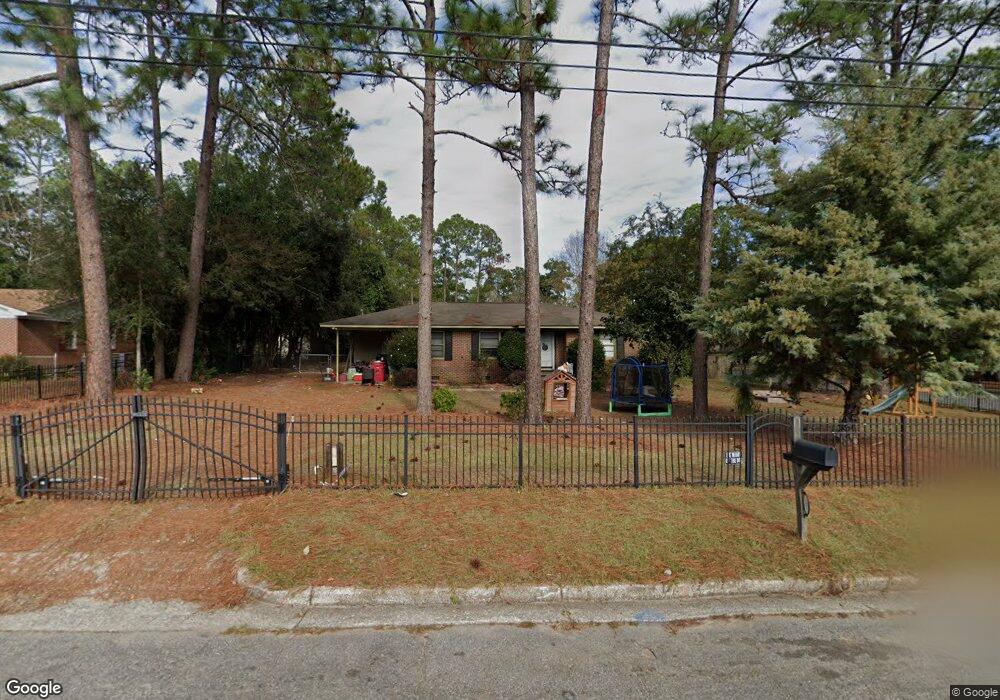
609 12th St E Tifton, GA 31794
Estimated Value: $173,000 - $229,000
3
Beds
2
Baths
1,714
Sq Ft
$116/Sq Ft
Est. Value
About This Home
This home is located at 609 12th St E, Tifton, GA 31794 and is currently estimated at $198,397, approximately $115 per square foot. 609 12th St E is a home located in Tift County with nearby schools including G.O. Bailey Elementary School, Charles Spencer Elementary School, and J.T. Reddick School.
Ownership History
Date
Name
Owned For
Owner Type
Purchase Details
Closed on
May 29, 2020
Sold by
Ilha Marcia
Bought by
Albrecht Crystal
Current Estimated Value
Home Financials for this Owner
Home Financials are based on the most recent Mortgage that was taken out on this home.
Original Mortgage
$150,000
Outstanding Balance
$131,485
Interest Rate
3.2%
Mortgage Type
VA
Estimated Equity
$66,912
Purchase Details
Closed on
Apr 1, 2009
Sold by
Shirley Mae Marchant Family Trust
Bought by
Ilha Marcia R
Home Financials for this Owner
Home Financials are based on the most recent Mortgage that was taken out on this home.
Original Mortgage
$113,898
Interest Rate
5.18%
Mortgage Type
FHA
Purchase Details
Closed on
Jul 25, 2007
Sold by
Trinity United Methodist C
Bought by
Marchant Shirley Fam Trust
Create a Home Valuation Report for This Property
The Home Valuation Report is an in-depth analysis detailing your home's value as well as a comparison with similar homes in the area
Purchase History
| Date | Buyer | Sale Price | Title Company |
|---|---|---|---|
| Albrecht Crystal | $150,000 | -- | |
| Ilha Marcia R | $116,000 | -- | |
| Marchant Shirley Fam Trust | $90,000 | -- |
Source: Public Records
Mortgage History
| Date | Status | Borrower | Loan Amount |
|---|---|---|---|
| Open | Albrecht Crystal | $150,000 | |
| Previous Owner | Ilha Marcia R | $113,898 |
Source: Public Records
Tax History
| Year | Tax Paid | Tax Assessment Tax Assessment Total Assessment is a certain percentage of the fair market value that is determined by local assessors to be the total taxable value of land and additions on the property. | Land | Improvement |
|---|---|---|---|---|
| 2025 | -- | $57,928 | $10,000 | $47,928 |
| 2024 | -- | $57,928 | $10,000 | $47,928 |
| 2023 | $0 | $48,930 | $4,400 | $44,530 |
| 2022 | $1,841 | $48,930 | $4,400 | $44,530 |
| 2021 | $1,853 | $48,930 | $4,400 | $44,530 |
| 2020 | $1,316 | $37,898 | $4,400 | $33,498 |
| 2019 | $1,316 | $37,898 | $4,400 | $33,498 |
| 2018 | $1,317 | $37,898 | $4,400 | $33,498 |
| 2017 | $1,353 | $37,898 | $4,400 | $33,498 |
| 2016 | $1,354 | $37,898 | $4,400 | $33,498 |
| 2015 | $1,356 | $37,898 | $4,400 | $33,498 |
| 2014 | $1,449 | $36,224 | $4,400 | $31,824 |
| 2013 | -- | $36,224 | $4,400 | $31,824 |
Source: Public Records
Map
Nearby Homes
- 801 12th St E
- 1003 Davis Ave
- 813 Belmont Ave
- 1001 Prince Ave Unit 6
- 1001 Prince Ave
- 810 Davis Ave
- 801 Belmont Ave
- 1209 Sussex Dr
- 722 6th 1 2 St
- 724 6th 1 2 St
- 1444 Madison Ave
- 810 Tift Ave N
- 409 Davis Ave
- 0 N Tift Ave Unit 141346
- 0 N Tift Ave Unit 7717290
- 1209 Central Ave N
- 0 Tift Ave
- 15 acres Us Highway 41
- 33.7 ac Us Highway 41
- 48 acres Us Highway 41
Your Personal Tour Guide
Ask me questions while you tour the home.