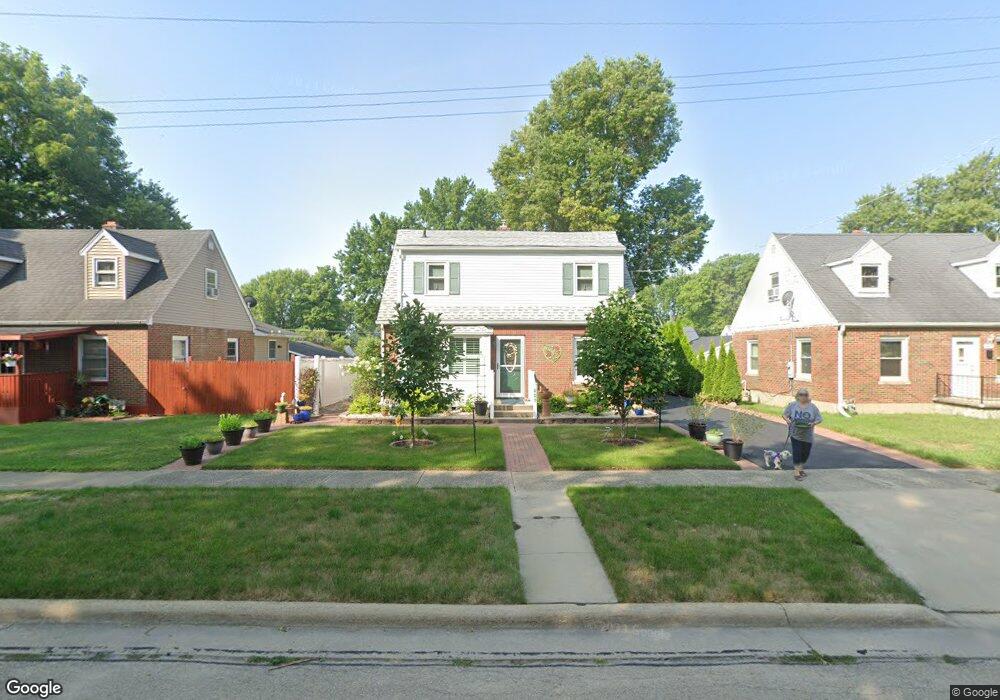
609 17th Ave Sterling, IL 61081
Estimated Value: $121,000 - $135,456
3
Beds
2
Baths
1,054
Sq Ft
$121/Sq Ft
Est. Value
About This Home
This home is located at 609 17th Ave, Sterling, IL 61081 and is currently estimated at $127,114, approximately $120 per square foot. 609 17th Ave is a home located in Whiteside County with nearby schools including Christ Lutheran School.
Ownership History
Date
Name
Owned For
Owner Type
Purchase Details
Closed on
Jun 2, 2008
Sold by
Wells Joseph I
Bought by
Wells Barbara
Current Estimated Value
Home Financials for this Owner
Home Financials are based on the most recent Mortgage that was taken out on this home.
Original Mortgage
$72,000
Interest Rate
6.01%
Mortgage Type
New Conventional
Purchase Details
Closed on
May 22, 2007
Sold by
Keenan Katherine
Bought by
Wells Joseph I
Home Financials for this Owner
Home Financials are based on the most recent Mortgage that was taken out on this home.
Original Mortgage
$72,000
Interest Rate
6.27%
Mortgage Type
New Conventional
Create a Home Valuation Report for This Property
The Home Valuation Report is an in-depth analysis detailing your home's value as well as a comparison with similar homes in the area
Home Values in the Area
Average Home Value in this Area
Purchase History
| Date | Buyer | Sale Price | Title Company |
|---|---|---|---|
| Wells Barbara | $90,000 | None Available | |
| Wells Joseph I | $90,000 | None Available |
Source: Public Records
Mortgage History
| Date | Status | Borrower | Loan Amount |
|---|---|---|---|
| Closed | Wells Barbara | $72,000 | |
| Previous Owner | Wells Joseph I | $72,000 |
Source: Public Records
Tax History
| Year | Tax Paid | Tax Assessment Tax Assessment Total Assessment is a certain percentage of the fair market value that is determined by local assessors to be the total taxable value of land and additions on the property. | Land | Improvement |
|---|---|---|---|---|
| 2024 | $2,667 | $36,576 | $3,482 | $33,094 |
| 2023 | $2,446 | $34,334 | $3,269 | $31,065 |
| 2022 | $2,335 | $32,850 | $3,128 | $29,722 |
| 2021 | $1,990 | $30,979 | $2,950 | $28,029 |
| 2020 | $2,004 | $29,894 | $2,847 | $27,047 |
| 2019 | $2,029 | $29,351 | $2,795 | $26,556 |
| 2018 | $2,004 | $29,398 | $2,799 | $26,599 |
| 2017 | $2,021 | $29,197 | $2,780 | $26,417 |
| 2016 | $1,930 | $28,256 | $2,690 | $25,566 |
| 2015 | $2,398 | $29,032 | $2,764 | $26,268 |
| 2014 | $1,847 | $28,388 | $2,703 | $25,685 |
| 2013 | $2,398 | $29,032 | $2,764 | $26,268 |
Source: Public Records
Map
Nearby Homes
Your Personal Tour Guide
Ask me questions while you tour the home.