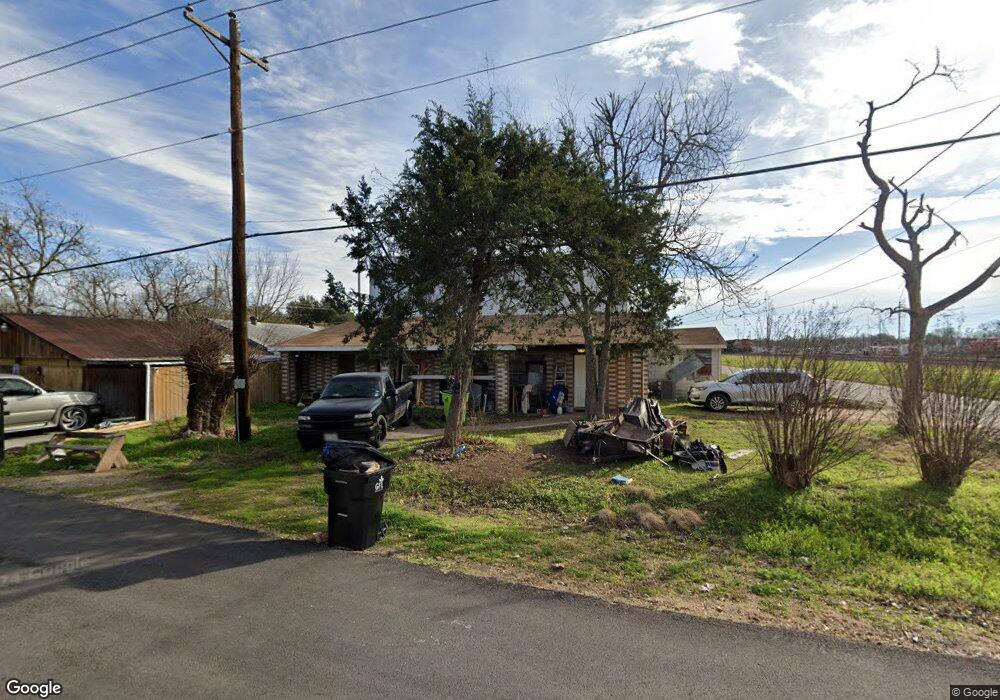
609 1st St Rosenberg, TX 77471
Estimated Value: $203,945 - $242,000
3
Beds
2
Baths
2,000
Sq Ft
$110/Sq Ft
Est. Value
About This Home
This home is located at 609 1st St, Rosenberg, TX 77471 and is currently estimated at $219,736, approximately $109 per square foot. 609 1st St is a home located in Fort Bend County with nearby schools including Jackson Elementary School, George Junior High School, and B.F. Terry High School.
Ownership History
Date
Name
Owned For
Owner Type
Purchase Details
Closed on
Dec 18, 2015
Sold by
Villaloboz Richard
Bought by
Villaloboz Lucy
Current Estimated Value
Purchase Details
Closed on
Jun 29, 2007
Sold by
Villaloboz Jesusa Gonzales Estate
Bought by
Villaloboz Lucy
Purchase Details
Closed on
Jul 5, 1996
Sold by
Villaloboz Bartolo and Villaloboz Jesusa
Bought by
Villaloboz Richard G
Purchase Details
Closed on
Mar 8, 1996
Sold by
Gonzales Antonio
Bought by
Villaloboz Bartolo
Purchase Details
Closed on
Feb 4, 1976
Sold by
Gamino Lucy
Bought by
Villaloboz Lucy
Create a Home Valuation Report for This Property
The Home Valuation Report is an in-depth analysis detailing your home's value as well as a comparison with similar homes in the area
Home Values in the Area
Average Home Value in this Area
Purchase History
| Date | Buyer | Sale Price | Title Company |
|---|---|---|---|
| Villaloboz Lucy | -- | None Available | |
| Villaloboz Lucy | -- | -- | |
| Villaloboz Richard G | -- | -- | |
| Villaloboz Bartolo | -- | Rosenberg Title Co | |
| Villaloboz Lucy | -- | -- |
Source: Public Records
Tax History
| Year | Tax Paid | Tax Assessment Tax Assessment Total Assessment is a certain percentage of the fair market value that is determined by local assessors to be the total taxable value of land and additions on the property. | Land | Improvement |
|---|---|---|---|---|
| 2025 | $2,978 | $145,311 | $27,518 | $117,793 |
| 2024 | $2,978 | $157,681 | $27,518 | $130,163 |
| 2023 | $2,791 | $144,576 | $24,422 | $120,154 |
| 2022 | $2,571 | $125,510 | $24,420 | $101,090 |
| 2021 | $2,228 | $107,390 | $24,420 | $82,970 |
| 2020 | $1,124 | $52,950 | $24,420 | $28,530 |
| 2019 | $1,049 | $45,930 | $17,440 | $28,490 |
| 2018 | $879 | $37,850 | $9,470 | $28,380 |
| 2017 | $862 | $36,910 | $9,470 | $27,440 |
| 2016 | $862 | $36,950 | $9,470 | $27,480 |
| 2015 | $873 | $37,200 | $9,470 | $27,730 |
| 2014 | $868 | $36,570 | $9,470 | $27,100 |
Source: Public Records
Map
Nearby Homes
Your Personal Tour Guide
Ask me questions while you tour the home.