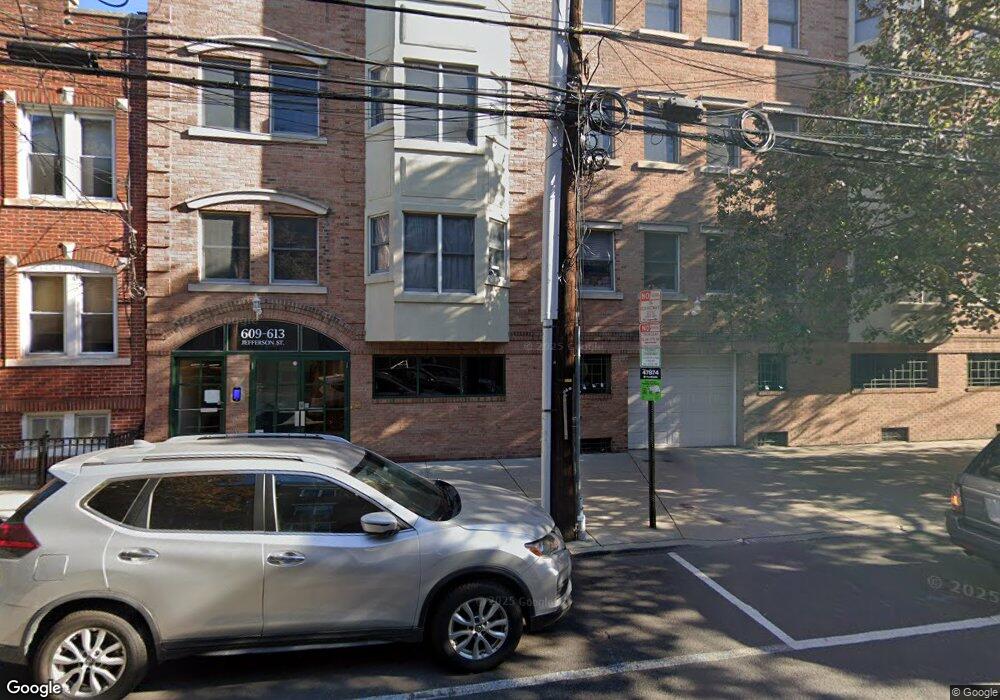
609-613 Jefferson St Hoboken, NJ 07030
Estimated Value: $940,000 - $1,060,000
--
Bed
--
Bath
1,174
Sq Ft
$833/Sq Ft
Est. Value
About This Home
This home is located at 609-613 Jefferson St, Hoboken, NJ 07030 and is currently estimated at $977,940, approximately $832 per square foot. 609-613 Jefferson St is a home located in Hudson County with nearby schools including Hoboken High School, Hoboken Charter School, and Hoboken Catholic Academy.
Ownership History
Date
Name
Owned For
Owner Type
Purchase Details
Closed on
Jan 17, 2022
Sold by
Adashev and Alla
Bought by
Banerjee Vishal and Banerjee Neha
Current Estimated Value
Home Financials for this Owner
Home Financials are based on the most recent Mortgage that was taken out on this home.
Original Mortgage
$584,925
Outstanding Balance
$541,436
Interest Rate
3.45%
Mortgage Type
New Conventional
Estimated Equity
$436,504
Purchase Details
Closed on
Jun 23, 2014
Sold by
Jia Kezhong and Liu Hongyan
Bought by
Adashev Alexander and Adashev Alla
Home Financials for this Owner
Home Financials are based on the most recent Mortgage that was taken out on this home.
Original Mortgage
$456,000
Interest Rate
4.16%
Mortgage Type
New Conventional
Create a Home Valuation Report for This Property
The Home Valuation Report is an in-depth analysis detailing your home's value as well as a comparison with similar homes in the area
Home Values in the Area
Average Home Value in this Area
Purchase History
| Date | Buyer | Sale Price | Title Company |
|---|---|---|---|
| Banerjee Vishal | $779,900 | Stewart Title Guaranty Company | |
| Adashev Alexander | $608,000 | Able Title Agency Llc |
Source: Public Records
Mortgage History
| Date | Status | Borrower | Loan Amount |
|---|---|---|---|
| Open | Banerjee Vishal | $584,925 | |
| Previous Owner | Adashev Alexander | $456,000 |
Source: Public Records
Tax History Compared to Growth
Tax History
| Year | Tax Paid | Tax Assessment Tax Assessment Total Assessment is a certain percentage of the fair market value that is determined by local assessors to be the total taxable value of land and additions on the property. | Land | Improvement |
|---|---|---|---|---|
| 2025 | $9,877 | $559,300 | $183,000 | $376,300 |
| 2024 | $9,111 | $559,300 | $183,000 | $376,300 |
| 2023 | $9,111 | $559,300 | $183,000 | $376,300 |
| 2022 | $8,954 | $559,300 | $183,000 | $376,300 |
| 2021 | $8,949 | $559,300 | $183,000 | $376,300 |
| 2020 | $9,010 | $559,300 | $183,000 | $376,300 |
| 2019 | $8,943 | $559,300 | $183,000 | $376,300 |
| 2018 | $8,837 | $559,300 | $183,000 | $376,300 |
| 2017 | $8,904 | $559,300 | $183,000 | $376,300 |
| 2016 | $8,675 | $559,300 | $183,000 | $376,300 |
| 2015 | $8,373 | $559,300 | $183,000 | $376,300 |
| 2014 | $7,987 | $559,300 | $183,000 | $376,300 |
Source: Public Records
Map
Nearby Homes
- 528 Adams St Unit 2
- 523 Jefferson St Unit 3
- 502 Jefferson St Unit 1
- 610 Clinton St Unit 2E
- 422 Grand St Unit 5
- 422 Grand St Unit 3
- 413 Jefferson St Unit 1
- 422 Madison St Unit 3L
- 717 Adams St Unit 4R
- 402 Grand St Unit 3S / 302
- 518 Monroe St Unit 2B
- 719 Adams St Unit 2R
- 510 Monroe St Unit 408
- 635 6th St Unit 2C
- 123 Willow Terrace
- 413 Monroe St Unit 500
- 407 Monroe St Unit 2C
- 418 Monroe St Unit 201
- 734 Adams St Unit 4D
- 412 Monroe St Unit 8
- 609-613 Jefferson St
- 609-613 Jefferson St
- 609-613 Jefferson St
- 609-613 Jefferson St
- 609-613 Jefferson St Unit 4C
- 609-613 Jefferson St Unit 2C
- 609-613 Jefferson St Unit 3D
- 609-613 Jefferson St Unit 2D
- 609-613 Jefferson St Unit 3C
- 609-613 Jefferson St Unit 5C
- 607 Jefferson St
- 607 Jefferson St Unit 1
- 607 Jefferson St
- 607 Jefferson St Unit 3
- 607 Jefferson St Unit 2
- 609 Jefferson St Unit 3A
- 609 Jefferson St Unit 2A
- 609 Jefferson St Unit 2B
- 609 Jefferson St Unit 3C
- 609 Jefferson St Unit 2D