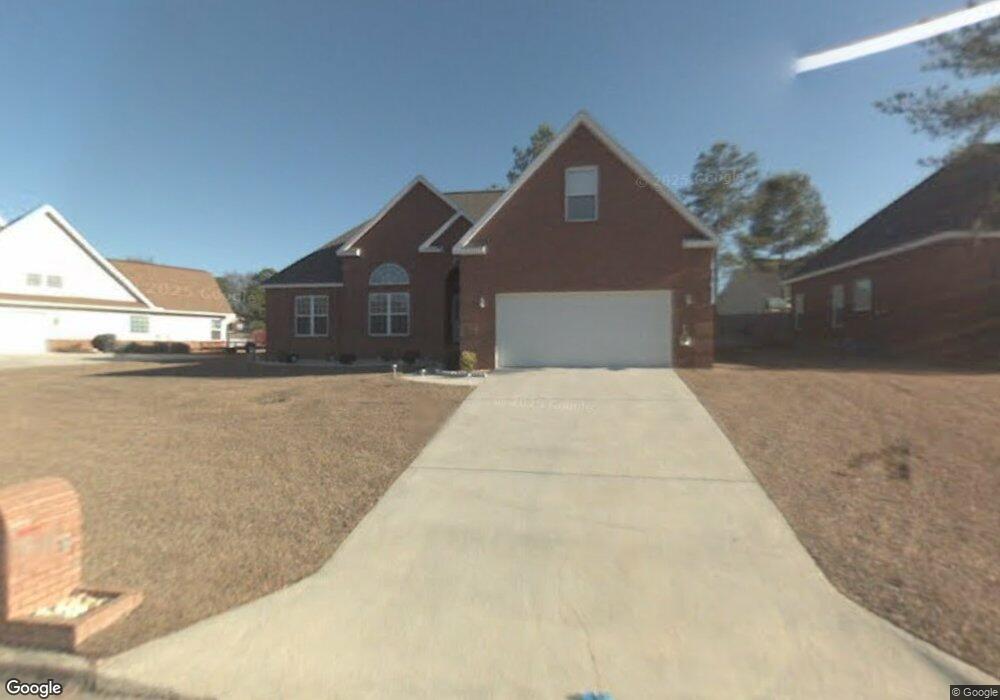
609 Bay Laurel Cir Warner Robins, GA 31088
Estimated Value: $285,241 - $316,000
3
Beds
2
Baths
1,943
Sq Ft
$156/Sq Ft
Est. Value
About This Home
This home is located at 609 Bay Laurel Cir, Warner Robins, GA 31088 and is currently estimated at $303,060, approximately $155 per square foot. 609 Bay Laurel Cir is a home located in Houston County with nearby schools including Lake Joy Primary School, Lake Joy Elementary School, and Feagin Mill Middle School.
Ownership History
Date
Name
Owned For
Owner Type
Purchase Details
Closed on
Aug 18, 2011
Sold by
Miranda Gonzalo N and Miranda Aleyda M
Bought by
Henderson James W and Henderson Candace G
Current Estimated Value
Home Financials for this Owner
Home Financials are based on the most recent Mortgage that was taken out on this home.
Original Mortgage
$158,500
Outstanding Balance
$108,029
Interest Rate
4.62%
Mortgage Type
New Conventional
Estimated Equity
$195,031
Purchase Details
Closed on
Dec 1, 2003
Sold by
Decked Out Llc
Bought by
Miranda Gonzalo N and Barrera Aleyda
Purchase Details
Closed on
Jun 23, 2003
Sold by
Zenith Builders Llc
Bought by
Decked Out Llc
Purchase Details
Closed on
Sep 18, 2002
Sold by
Hawthorne Group
Bought by
Zenith Builders Llc
Create a Home Valuation Report for This Property
The Home Valuation Report is an in-depth analysis detailing your home's value as well as a comparison with similar homes in the area
Home Values in the Area
Average Home Value in this Area
Purchase History
| Date | Buyer | Sale Price | Title Company |
|---|---|---|---|
| Henderson James W | $158,500 | None Available | |
| Miranda Gonzalo N | $160,000 | -- | |
| Decked Out Llc | $32,900 | -- | |
| Zenith Builders Llc | $31,000 | -- |
Source: Public Records
Mortgage History
| Date | Status | Borrower | Loan Amount |
|---|---|---|---|
| Open | Henderson James W | $158,500 |
Source: Public Records
Tax History
| Year | Tax Paid | Tax Assessment Tax Assessment Total Assessment is a certain percentage of the fair market value that is determined by local assessors to be the total taxable value of land and additions on the property. | Land | Improvement |
|---|---|---|---|---|
| 2025 | $2,691 | $96,280 | $12,400 | $83,880 |
| 2024 | $3,015 | $92,120 | $12,400 | $79,720 |
| 2023 | $2,668 | $80,920 | $12,400 | $68,520 |
| 2022 | $1,747 | $75,960 | $12,400 | $63,560 |
| 2021 | $1,504 | $65,040 | $12,400 | $52,640 |
| 2020 | $1,509 | $64,960 | $12,400 | $52,560 |
| 2019 | $1,509 | $64,960 | $12,400 | $52,560 |
| 2018 | $1,509 | $64,960 | $12,400 | $52,560 |
| 2017 | $1,404 | $60,360 | $12,400 | $47,960 |
| 2016 | $1,406 | $60,360 | $12,400 | $47,960 |
| 2015 | -- | $60,360 | $12,400 | $47,960 |
| 2014 | $701 | $60,360 | $12,400 | $47,960 |
| 2013 | $701 | $65,480 | $12,400 | $53,080 |
Source: Public Records
Map
Nearby Homes
- 105 White Pond Ln
- 108 Musket Fire Ln
- 211 Buckhead Forest Dr
- 109 Erin Lee Ct
- 209 Buckhead Forest Dr
- 218 Knob Hill Dr
- 102 Stonemill Dr
- 302 Estates Way
- 101 Bay Laurel Cir
- 1124 Panola Cir
- 108 Havelock Cir
- 120 Country Walk
- 111 Ellice Ct
- 104 Trotters Ct
- 319 Tyson Glen Dr
- 103 Emberly Ln
- 316 Haverhill Cir
- 201 Running Creek Dr
- 204 Bridgeway Dr
- 510 Cheshire Dr
- 611 Bay Laurel Cir
- 607 Bay Laurel Cir
- 204 White Pond Ln
- 206 White Pond Ln
- 613 Bay Laurel Cir
- 605 Bay Laurel Cir
- 610 Bay Laurel Cir
- 612 Bay Laurel Cir
- 608 Bay Laurel Cir
- 614 Bay Laurel Cir
- 202 White Pond Ln
- 615 Bay Laurel Cir
- 603 Bay Laurel Cir
- 616 Bay Laurel Cir
- 606 Bay Laurel Cir
- 205 White Pond Ln
- 701 Bay Laurel Cir
- 703 Bay Laurel Cir
- 618 Bay Laurel Cir
- 604 Bay Laurel Cir
Your Personal Tour Guide
Ask me questions while you tour the home.