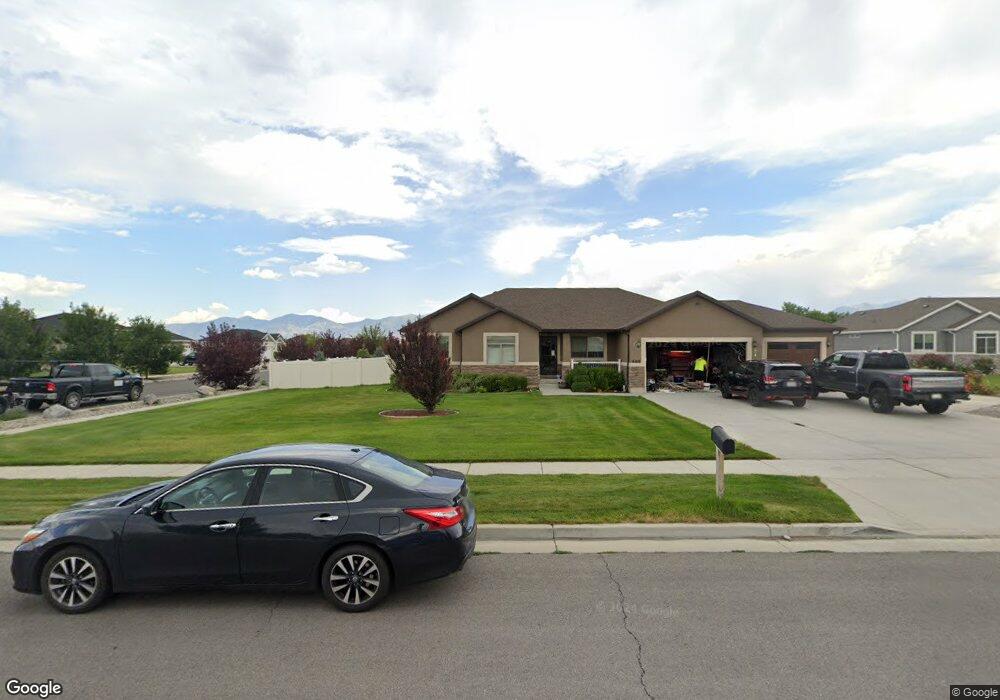
609 Bronco Ct Grantsville, UT 84029
Estimated Value: $578,000 - $680,000
--
Bed
--
Bath
3,014
Sq Ft
$209/Sq Ft
Est. Value
About This Home
This home is located at 609 Bronco Ct, Grantsville, UT 84029 and is currently estimated at $629,463, approximately $208 per square foot. 609 Bronco Ct is a home with nearby schools including Grantsville Junior High School and Grantsville High School.
Ownership History
Date
Name
Owned For
Owner Type
Purchase Details
Closed on
Jun 7, 2021
Sold by
Flemming Lucas John and Flemming Natasha Anna
Bought by
Flemming Lucas John
Current Estimated Value
Home Financials for this Owner
Home Financials are based on the most recent Mortgage that was taken out on this home.
Original Mortgage
$325,000
Outstanding Balance
$294,247
Interest Rate
2.9%
Mortgage Type
New Conventional
Estimated Equity
$335,216
Purchase Details
Closed on
Dec 19, 2016
Sold by
Compass Point Construction Llc
Bought by
Flemming Lucas John and Flemming Natasha Anna
Home Financials for this Owner
Home Financials are based on the most recent Mortgage that was taken out on this home.
Original Mortgage
$308,691
Interest Rate
3.54%
Mortgage Type
VA
Purchase Details
Closed on
Aug 24, 2016
Sold by
Tp Development Inc
Bought by
Compass Point Construction Llc
Create a Home Valuation Report for This Property
The Home Valuation Report is an in-depth analysis detailing your home's value as well as a comparison with similar homes in the area
Home Values in the Area
Average Home Value in this Area
Purchase History
| Date | Buyer | Sale Price | Title Company |
|---|---|---|---|
| Flemming Lucas John | -- | Inwest Title | |
| Flemming Lucas John | -- | Artisan Title Inc | |
| Compass Point Construction Llc | -- | Artisan Title Inc Ach |
Source: Public Records
Mortgage History
| Date | Status | Borrower | Loan Amount |
|---|---|---|---|
| Open | Flemming Lucas John | $325,000 | |
| Closed | Flemming Lucas John | $308,691 |
Source: Public Records
Tax History Compared to Growth
Tax History
| Year | Tax Paid | Tax Assessment Tax Assessment Total Assessment is a certain percentage of the fair market value that is determined by local assessors to be the total taxable value of land and additions on the property. | Land | Improvement |
|---|---|---|---|---|
| 2025 | $2,494 | $341,994 | $66,000 | $275,994 |
| 2024 | $2,494 | $304,772 | $66,000 | $238,772 |
| 2023 | $2,494 | $314,344 | $66,000 | $248,344 |
| 2022 | $2,589 | $295,062 | $85,250 | $209,812 |
| 2021 | $2,065 | $210,098 | $56,375 | $153,723 |
| 2020 | $2,032 | $367,377 | $102,500 | $264,877 |
| 2019 | $2,677 | $345,497 | $60,000 | $285,497 |
| 2018 | $2,628 | $319,543 | $60,000 | $259,543 |
| 2017 | $2,478 | $319,543 | $60,000 | $259,543 |
| 2016 | -- | $60,000 | $60,000 | $0 |
Source: Public Records
Map
Nearby Homes
- 539 S Chan Dr
- 428 S Saddle Rd
- 415 Worthington St
- 628 E Otto Ln Unit 408
- 565 E Otto Ln Unit 421
- 393 Roadster Ln
- 432 S Tandem Ct
- 4795 Highway 112
- 368 E Stafford St Unit 127
- 382 E Stafford St Unit 126
- 416 E Spruce Ln Unit 113
- 432 E Stafford St Unit 121
- 538 S Musk Ave
- 306 S Rockaway Cove
- 565 S Mckay W
- 269 S 900 E
- 537 E Fiona Cir
- 427 E Redwood Ln Unit 120
- 426 E Redwood Ln Unit 119
- 400 N 250 W
- 621 Bronco Ct
- 610 Red Hawk Ct
- 622 Red Hawk Ct
- 797 Welles Cannon Rd
- 805 Welles Cannon Rd
- 789 Welles Cannon Rd
- 627 Bronco Ct
- 610 Bronco Ct
- 813 Welles Cannon Rd
- 622 Bronco Ct
- 626 Bronco Ct
- 628 Red Hawk Ct
- 781 Welles Cannon Rd Unit 604
- 821 Welles Cannon Rd
- 802 E Saddle Horn Rd Unit 510
- 802 E Saddle Horn Rd
- 797 E Sunset View Rd Unit 721
- 805 E Sunset View Rd
- 789 E Sunset View Rd
- 609 Red Hawk Ct