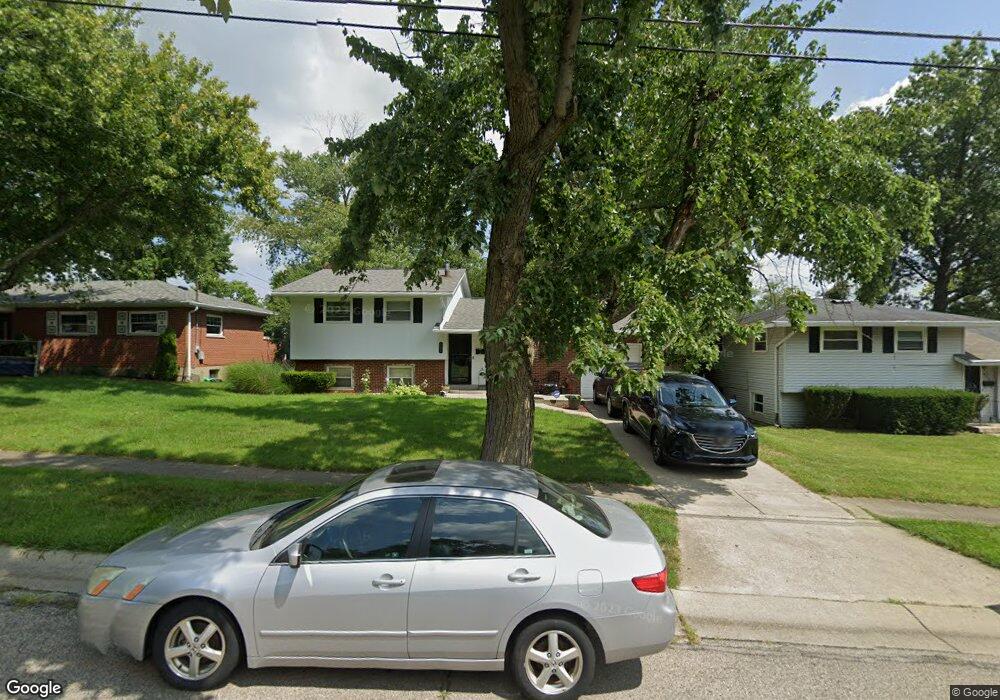
609 Cascade Rd Cincinnati, OH 45240
Estimated Value: $205,000 - $233,000
3
Beds
2
Baths
1,559
Sq Ft
$143/Sq Ft
Est. Value
About This Home
This home is located at 609 Cascade Rd, Cincinnati, OH 45240 and is currently estimated at $222,299, approximately $142 per square foot. 609 Cascade Rd is a home located in Hamilton County with nearby schools including Calvary Academy- The and St Gabriel Consolidated School.
Ownership History
Date
Name
Owned For
Owner Type
Purchase Details
Closed on
Mar 21, 2003
Sold by
Wilson Timothy A and Wilson Sharon L
Bought by
Cole Virgil and Cole Marquesa Y
Current Estimated Value
Home Financials for this Owner
Home Financials are based on the most recent Mortgage that was taken out on this home.
Original Mortgage
$114,098
Outstanding Balance
$47,579
Interest Rate
5.96%
Mortgage Type
FHA
Estimated Equity
$174,720
Purchase Details
Closed on
Dec 5, 2001
Sold by
Imc Mtg Company
Bought by
Wilson Timothy A and Wilson Sharon L
Home Financials for this Owner
Home Financials are based on the most recent Mortgage that was taken out on this home.
Original Mortgage
$58,400
Interest Rate
5.87%
Purchase Details
Closed on
Feb 6, 2001
Sold by
Jones Michael P and Jones Ruth A
Bought by
The Chase Manhattan Bank and Imc Home Equity Loan Trust 1998-3
Create a Home Valuation Report for This Property
The Home Valuation Report is an in-depth analysis detailing your home's value as well as a comparison with similar homes in the area
Home Values in the Area
Average Home Value in this Area
Purchase History
| Date | Buyer | Sale Price | Title Company |
|---|---|---|---|
| Cole Virgil | $115,000 | Title Resolutions | |
| Wilson Timothy A | $74,000 | Precision Land Title Agency | |
| The Chase Manhattan Bank | $60,000 | Tower City Title Agency Inc |
Source: Public Records
Mortgage History
| Date | Status | Borrower | Loan Amount |
|---|---|---|---|
| Open | Cole Virgil | $114,098 | |
| Closed | Wilson Timothy A | $58,400 |
Source: Public Records
Tax History
| Year | Tax Paid | Tax Assessment Tax Assessment Total Assessment is a certain percentage of the fair market value that is determined by local assessors to be the total taxable value of land and additions on the property. | Land | Improvement |
|---|---|---|---|---|
| 2025 | $3,158 | $53,659 | $9,139 | $44,520 |
| 2023 | $3,116 | $53,659 | $9,139 | $44,520 |
| 2022 | $2,944 | $38,388 | $8,127 | $30,261 |
| 2021 | $2,876 | $38,388 | $8,127 | $30,261 |
| 2020 | $2,913 | $38,388 | $8,127 | $30,261 |
| 2019 | $2,764 | $31,991 | $6,773 | $25,218 |
| 2018 | $2,771 | $31,991 | $6,773 | $25,218 |
| 2017 | $2,665 | $31,991 | $6,773 | $25,218 |
| 2016 | $2,548 | $29,971 | $7,151 | $22,820 |
| 2015 | $2,365 | $29,971 | $7,151 | $22,820 |
| 2014 | $2,183 | $29,971 | $7,151 | $22,820 |
| 2013 | $2,250 | $31,546 | $7,525 | $24,021 |
Source: Public Records
Map
Nearby Homes
- 564 Waycross Rd
- 602 Brightview Place Unit 34
- 612 Brightview Place Unit 30
- 614 Brightview Place Unit 29
- 626 Brightview Place Unit 24
- 622 Brightview Place Unit 26
- 620 Brightview Place Unit 27
- 624 Brightview Place Unit 25
- 483 Vista Glen Dr
- 162 Sheffield Rd
- 440 W Sharon Rd
- 38 Handel Ln
- 16 Japonica Dr
- 37 Hayden Dr
- 1 Jennings Rd
- 1013 Ligorio Ave
- 10483 Toulon Dr
- 34 Gambier Cir
- 920 Waycross Rd
- 11481 Fremantle Dr
- 605 Cascade Rd
- 611 Cascade Rd
- 617 Waycross Rd
- 603 Cascade Rd
- 613 Cascade Rd
- 619 Waycross Rd
- 615 Waycross Rd
- 610 Cascade Rd
- 621 Waycross Rd
- 606 Cascade Rd
- 611 Waycross Rd
- 612 Cascade Rd
- 617 Cascade Rd
- 604 Cascade Rd
- 663 Carlsbad Rd
- 614 Cascade Rd
- 657 Carlsbad Rd
- 609 Waycross Rd
- 600 Cascade Rd
- 653 Carlsbad Rd
Your Personal Tour Guide
Ask me questions while you tour the home.