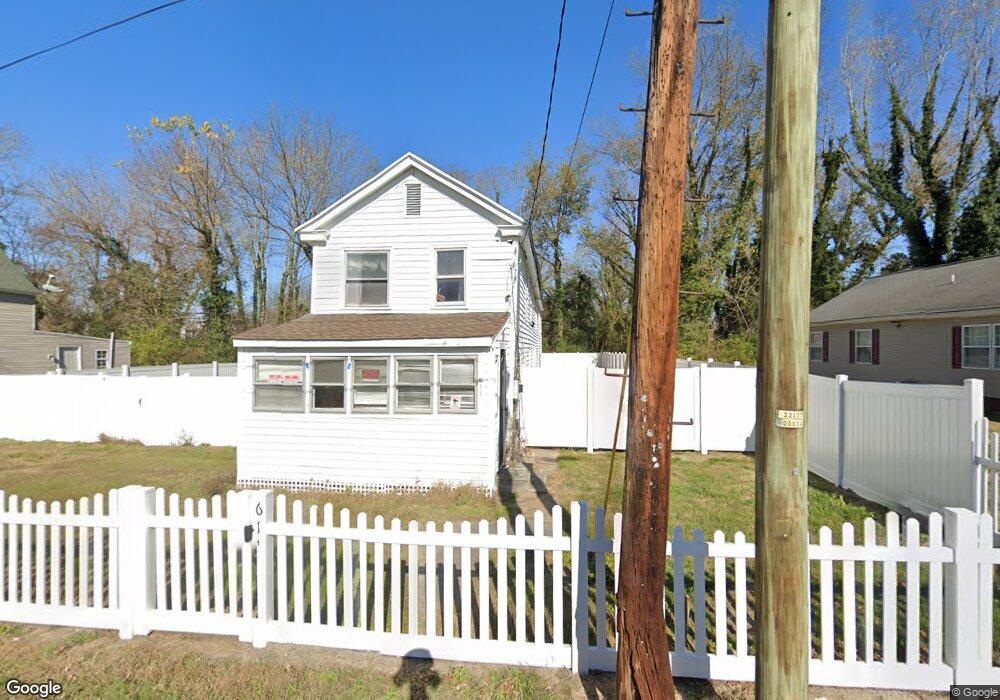
609 Cross St Cambridge, MD 21613
Estimated Value: $79,000 - $141,000
Studio
1
Bath
1,080
Sq Ft
$102/Sq Ft
Est. Value
About This Home
This home is located at 609 Cross St, Cambridge, MD 21613 and is currently estimated at $110,000, approximately $101 per square foot. 609 Cross St is a home located in Dorchester County with nearby schools including Maple Elementary School, Mace's Lane Middle School, and Cambridge-South Dorchester High School.
Ownership History
Date
Name
Owned For
Owner Type
Purchase Details
Closed on
Nov 13, 2020
Sold by
Graham Patricia J
Bought by
Graham Patricia J
Current Estimated Value
Purchase Details
Closed on
Nov 5, 2019
Sold by
Dorchester County Maryland
Bought by
Graham Patricia J
Purchase Details
Closed on
Jun 24, 2019
Sold by
Quality Housing Of Cambridge Llc
Bought by
Dorchester County
Purchase Details
Closed on
Oct 6, 2016
Sold by
Dorchester County
Bought by
Quality Housing Of Cambridge Llc
Purchase Details
Closed on
Aug 14, 2015
Sold by
Jackson Lillian A
Bought by
Dorchester County Maryland
Create a Home Valuation Report for This Property
The Home Valuation Report is an in-depth analysis detailing your home's value as well as a comparison with similar homes in the area
Home Values in the Area
Average Home Value in this Area
Purchase History
| Date | Buyer | Sale Price | Title Company |
|---|---|---|---|
| Graham Patricia J | -- | None Available | |
| Graham Patricia J | -- | None Available | |
| Dorchester County | -- | None Available | |
| Quality Housing Of Cambridge Llc | -- | Attorney | |
| Dorchester County Maryland | $923 | Attorney |
Source: Public Records
Tax History
| Year | Tax Paid | Tax Assessment Tax Assessment Total Assessment is a certain percentage of the fair market value that is determined by local assessors to be the total taxable value of land and additions on the property. | Land | Improvement |
|---|---|---|---|---|
| 2025 | $53 | $2,800 | $2,800 | $0 |
| 2024 | $37 | $2,400 | $0 | $0 |
| 2023 | $37 | $2,000 | $0 | $0 |
| 2022 | $30 | $1,600 | $1,600 | $0 |
| 2021 | $123 | $1,600 | $1,600 | $0 |
| 2020 | $123 | $10,600 | $5,700 | $4,900 |
| 2019 | $282 | $15,200 | $5,700 | $9,500 |
| 2018 | $282 | $15,200 | $5,700 | $9,500 |
| 2017 | $144 | $15,200 | $0 | $0 |
| 2016 | -- | $23,700 | $0 | $0 |
| 2015 | -- | $23,700 | $0 | $0 |
| 2014 | $489 | $23,700 | $0 | $0 |
Source: Public Records
Map
Nearby Homes
Your Personal Tour Guide
Ask me questions while you tour the home.