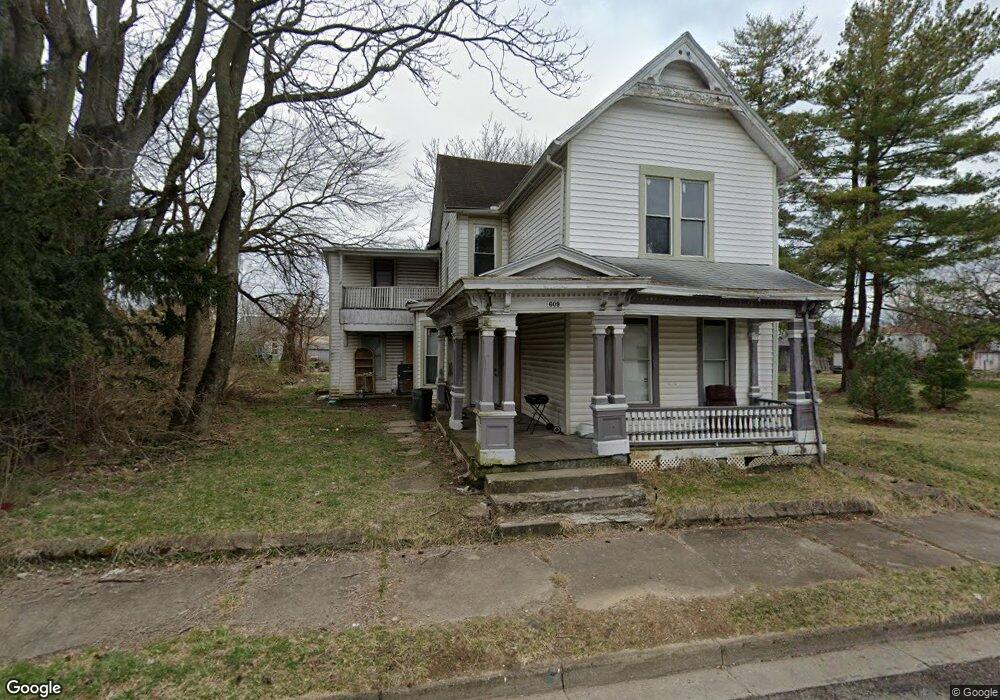
609 Dibert Ave Springfield, OH 45506
Estimated Value: $56,000 - $141,000
4
Beds
2
Baths
2,314
Sq Ft
$37/Sq Ft
Est. Value
About This Home
This home is located at 609 Dibert Ave, Springfield, OH 45506 and is currently estimated at $86,648, approximately $37 per square foot. 609 Dibert Ave is a home located in Clark County with nearby schools including Fulton Elementary School, Hayward Middle School, and Springfield High School.
Ownership History
Date
Name
Owned For
Owner Type
Purchase Details
Closed on
Oct 24, 2021
Sold by
Huffman Doris and Huffman Steven
Bought by
Caupp Ruth Ann
Current Estimated Value
Purchase Details
Closed on
Oct 2, 2020
Sold by
Shank David R and Huffman Doris M
Bought by
Caupp Ruth Ann
Home Financials for this Owner
Home Financials are based on the most recent Mortgage that was taken out on this home.
Original Mortgage
$5,000
Interest Rate
2.9%
Mortgage Type
Land Contract Argmt. Of Sale
Purchase Details
Closed on
Apr 28, 2020
Sold by
Estate Of Joseph R Shank
Bought by
Shank David R and Huffman Doris
Purchase Details
Closed on
Oct 15, 2018
Sold by
Shank Joseph R
Bought by
Taylor Banjamin and Taylor Sarah
Home Financials for this Owner
Home Financials are based on the most recent Mortgage that was taken out on this home.
Original Mortgage
$13,500
Interest Rate
4.6%
Mortgage Type
Land Contract Argmt. Of Sale
Purchase Details
Closed on
Aug 18, 1993
Sold by
Shank Joseph R and Shank Christine E
Bought by
Shank Joseph R
Create a Home Valuation Report for This Property
The Home Valuation Report is an in-depth analysis detailing your home's value as well as a comparison with similar homes in the area
Home Values in the Area
Average Home Value in this Area
Purchase History
| Date | Buyer | Sale Price | Title Company |
|---|---|---|---|
| Caupp Ruth Ann | $5,000 | None Available | |
| Caupp Ruth Ann | $5,000 | None Available | |
| Shank David R | -- | None Available | |
| Taylor Banjamin | $13,500 | None Available | |
| Shank Joseph R | -- | -- |
Source: Public Records
Mortgage History
| Date | Status | Borrower | Loan Amount |
|---|---|---|---|
| Previous Owner | Caupp Ruth Ann | $5,000 | |
| Previous Owner | Taylor Banjamin | $13,500 |
Source: Public Records
Tax History
| Year | Tax Paid | Tax Assessment Tax Assessment Total Assessment is a certain percentage of the fair market value that is determined by local assessors to be the total taxable value of land and additions on the property. | Land | Improvement |
|---|---|---|---|---|
| 2025 | $705 | $22,210 | $1,130 | $21,080 |
| 2024 | $687 | $13,910 | $850 | $13,060 |
| 2023 | $687 | $13,910 | $850 | $13,060 |
| 2022 | $1,108 | $13,910 | $850 | $13,060 |
| 2021 | $728 | $13,240 | $810 | $12,430 |
| 2020 | $729 | $13,240 | $810 | $12,430 |
| 2019 | $731 | $13,240 | $810 | $12,430 |
| 2018 | $656 | $11,400 | $810 | $10,590 |
| 2017 | $655 | $11,393 | $805 | $10,588 |
| 2016 | $656 | $11,393 | $805 | $10,588 |
| 2015 | $669 | $11,393 | $805 | $10,588 |
| 2014 | $666 | $11,393 | $805 | $10,588 |
| 2013 | $659 | $11,393 | $805 | $10,588 |
Source: Public Records
Map
Nearby Homes
- 410 W Liberty St
- 1002 S Yellow Springs St
- 802 Innisfallen Ave
- 830 Dibert Ave
- 525 S Light St
- 506 W Southern Ave
- 326 W Grand Ave
- 916 Innisfallen Ave
- 659 W Mulberry St Unit 661
- 405 W Southern Ave
- 311 W Grand Ave
- 709-711 W Mulberry St
- 770 W State St
- 209 W Liberty St
- 929 S Western Ave
- 702 S Wittenberg Ave
- 550 W Parkwood Ave
- 727 W High St
- 1124 W Mulberry St
- 1230 W Pleasant St
- 613 Dibert Ave
- 617 Dibert Ave Unit 619
- 600 W Liberty St
- 530 W Liberty St
- 618 W Liberty St
- 528 W Liberty St
- 621 Dibert Ave
- 526 W Liberty St
- 620 W Liberty St
- 614 Dibert Ave
- 604 Dibert Ave
- 525 Dibert Ave
- 524 W Liberty St
- 522 W Liberty St
- 528 Dibert Ave
- 521 Dibert Ave
- 802 S Yellow Springs St
- 816 S Yellow Springs St
- 518 W Liberty St Unit 520
- 522 Dibert Ave
Your Personal Tour Guide
Ask me questions while you tour the home.